
YOUR NEIGHBORS IN REAL ESTATE


Hablamos Español


YEAR IN REVIEW
Shenandoah Miami Real Estate: 2024 Year in Review
By Jorge Fernandez, REALTOR®
Market data and analysis from Jorge Fernandez, Shenandoah resident and local real estate market expert, with The Shenandoah Guys at SERHANT.
A full-year look at Shenandoah single-family sales in 2024: prices, pace, negotiating power and how our neighborhood’s market changed compared with 2023.
2024 Shenandoah Real Estate at a Glance
Single-family homes · Southeast Florida MLS · Change vs. 2023
LABEL
—
—
LABEL
—
—
LABEL
—
—
LABEL
—
—
LABEL
—
—
Months of inventory
Calculation
MEDIAN SALE PRICE
$879,000
↑ 10.2% vs. 2023
MEDIAN SOLD $ / SQ. FT.
$538
↑ 7.4% vs. 2023
CLOSED SALES
108
↓ 10 vs. 2023
TOTAL SALES VOLUME
$102.8M
↓ 0.8% vs. 2023
SOLD VS. ORIGINAL LIST PRICE
93.3%
↑ 0.4 pts vs. 2023
MEDIAN DAYS ON MARKET
48
↓ 6 days vs. 2023
MARKET ACTIVITY
144
Homes Listed for Sale
↓ 19 vs. 2023
95.4%
Sold vs. Final List Price
↓ 0.7 pts vs. 2023
36%
Sold After Price Reduction
↓ 8 pts vs. 2023
—
Label
—
Label
Year to date
The 2024 Shenandoah Market in Review
Shenandoah’s 2024 story was higher prices and fewer, more selective sales. 108 single-family homes closed in Shenandoah, down from 118 in 2023. Total sales volume held essentially flat at $102.8 million because the typical home sold for more. The median sale price rose 10.2% to $879,000, and the median price per square foot rose 7.4% to $538. Both outpaced Miami-Dade County as a whole, where the single-family median rose 8.3% to $650,000.
Much of the year was spent waiting on interest rates. Thirty-year mortgage rates started the year in the mid-6% range, climbed back above 7% in the spring, and fell to about 6.1% in late September as the Federal Reserve began cutting. The Fed cut by half a point in September and a quarter point each in November and December, its first cuts since 2020. The relief was short-lived: by December, mortgage rates were back near 7%. Add rising homeowners insurance costs across Florida, the new rules for buyer-agent agreements that took effect in August, a presidential election, and two major hurricanes on Florida’s Gulf Coast in the fall, and many of our neighbors simply stayed put. Only 144 Shenandoah homes were listed for sale, the fewest of any year since at least 2016.
Limited supply kept the market balanced rather than soft. Homes sold faster than in 2023, at a median of 48 days on market vs. 54. Fewer sellers needed a price reduction: 36% of sales vs. 44%. A quarter of homes sold at or above their final asking price. Buyers were still negotiating, though. The typical sale closed at 93.3% of the original list price, and more than one in three listings that came off the market in 2024 did so without selling. For sellers, pricing correctly from day one remained the difference between a quick sale and a long one.
I’m also seeing our neighborhood move steadily upmarket. Sales under $750,000 fell from 48 to 28 as entry-level homes became harder to find. Sales of $1 million and above rose to 38, about 35% of all sales, up from 25%. New construction is still a small part of the market but an influential one: four new homes sold at a median of $642 per square foot. The year’s top sale was a 2023-built home at 2011 SW 13th Street for $1,988,000. One of 2024’s $1 million-plus sales was my listing at 2011 SW 18th Street, a 1955 home on a 6,960-square-foot lot that sold in February for $1,075,000, featured below.
Our neighborhood’s history took center stage in December. The Villagers, Miami’s historic preservation society, featured Miami’s Historic Shenandoah Neighborhood in its 39th Annual Historic Home Tour, which I was proud to sponsor. The tour showcased homes from the 1920s and 1930s in the Craftsman, Mediterranean Revival and Mission styles, along with a coral rock home and a Sears kit Colonial house.
Shenandoah Since 2016: The Long-Term Trend
2016 – 2024 · single-family homes · one point per year
Median Sale Price
Full-year median, 2016–2024
Median Price per Sq. Ft.
Full-year median, 2016–2024
Closed Sales per Year
Single-family homes
Sold vs. Original List Price
Median, as a percent of original asking price
FEATURED 2024 CLOSING
2011 SW 18th Street, Miami
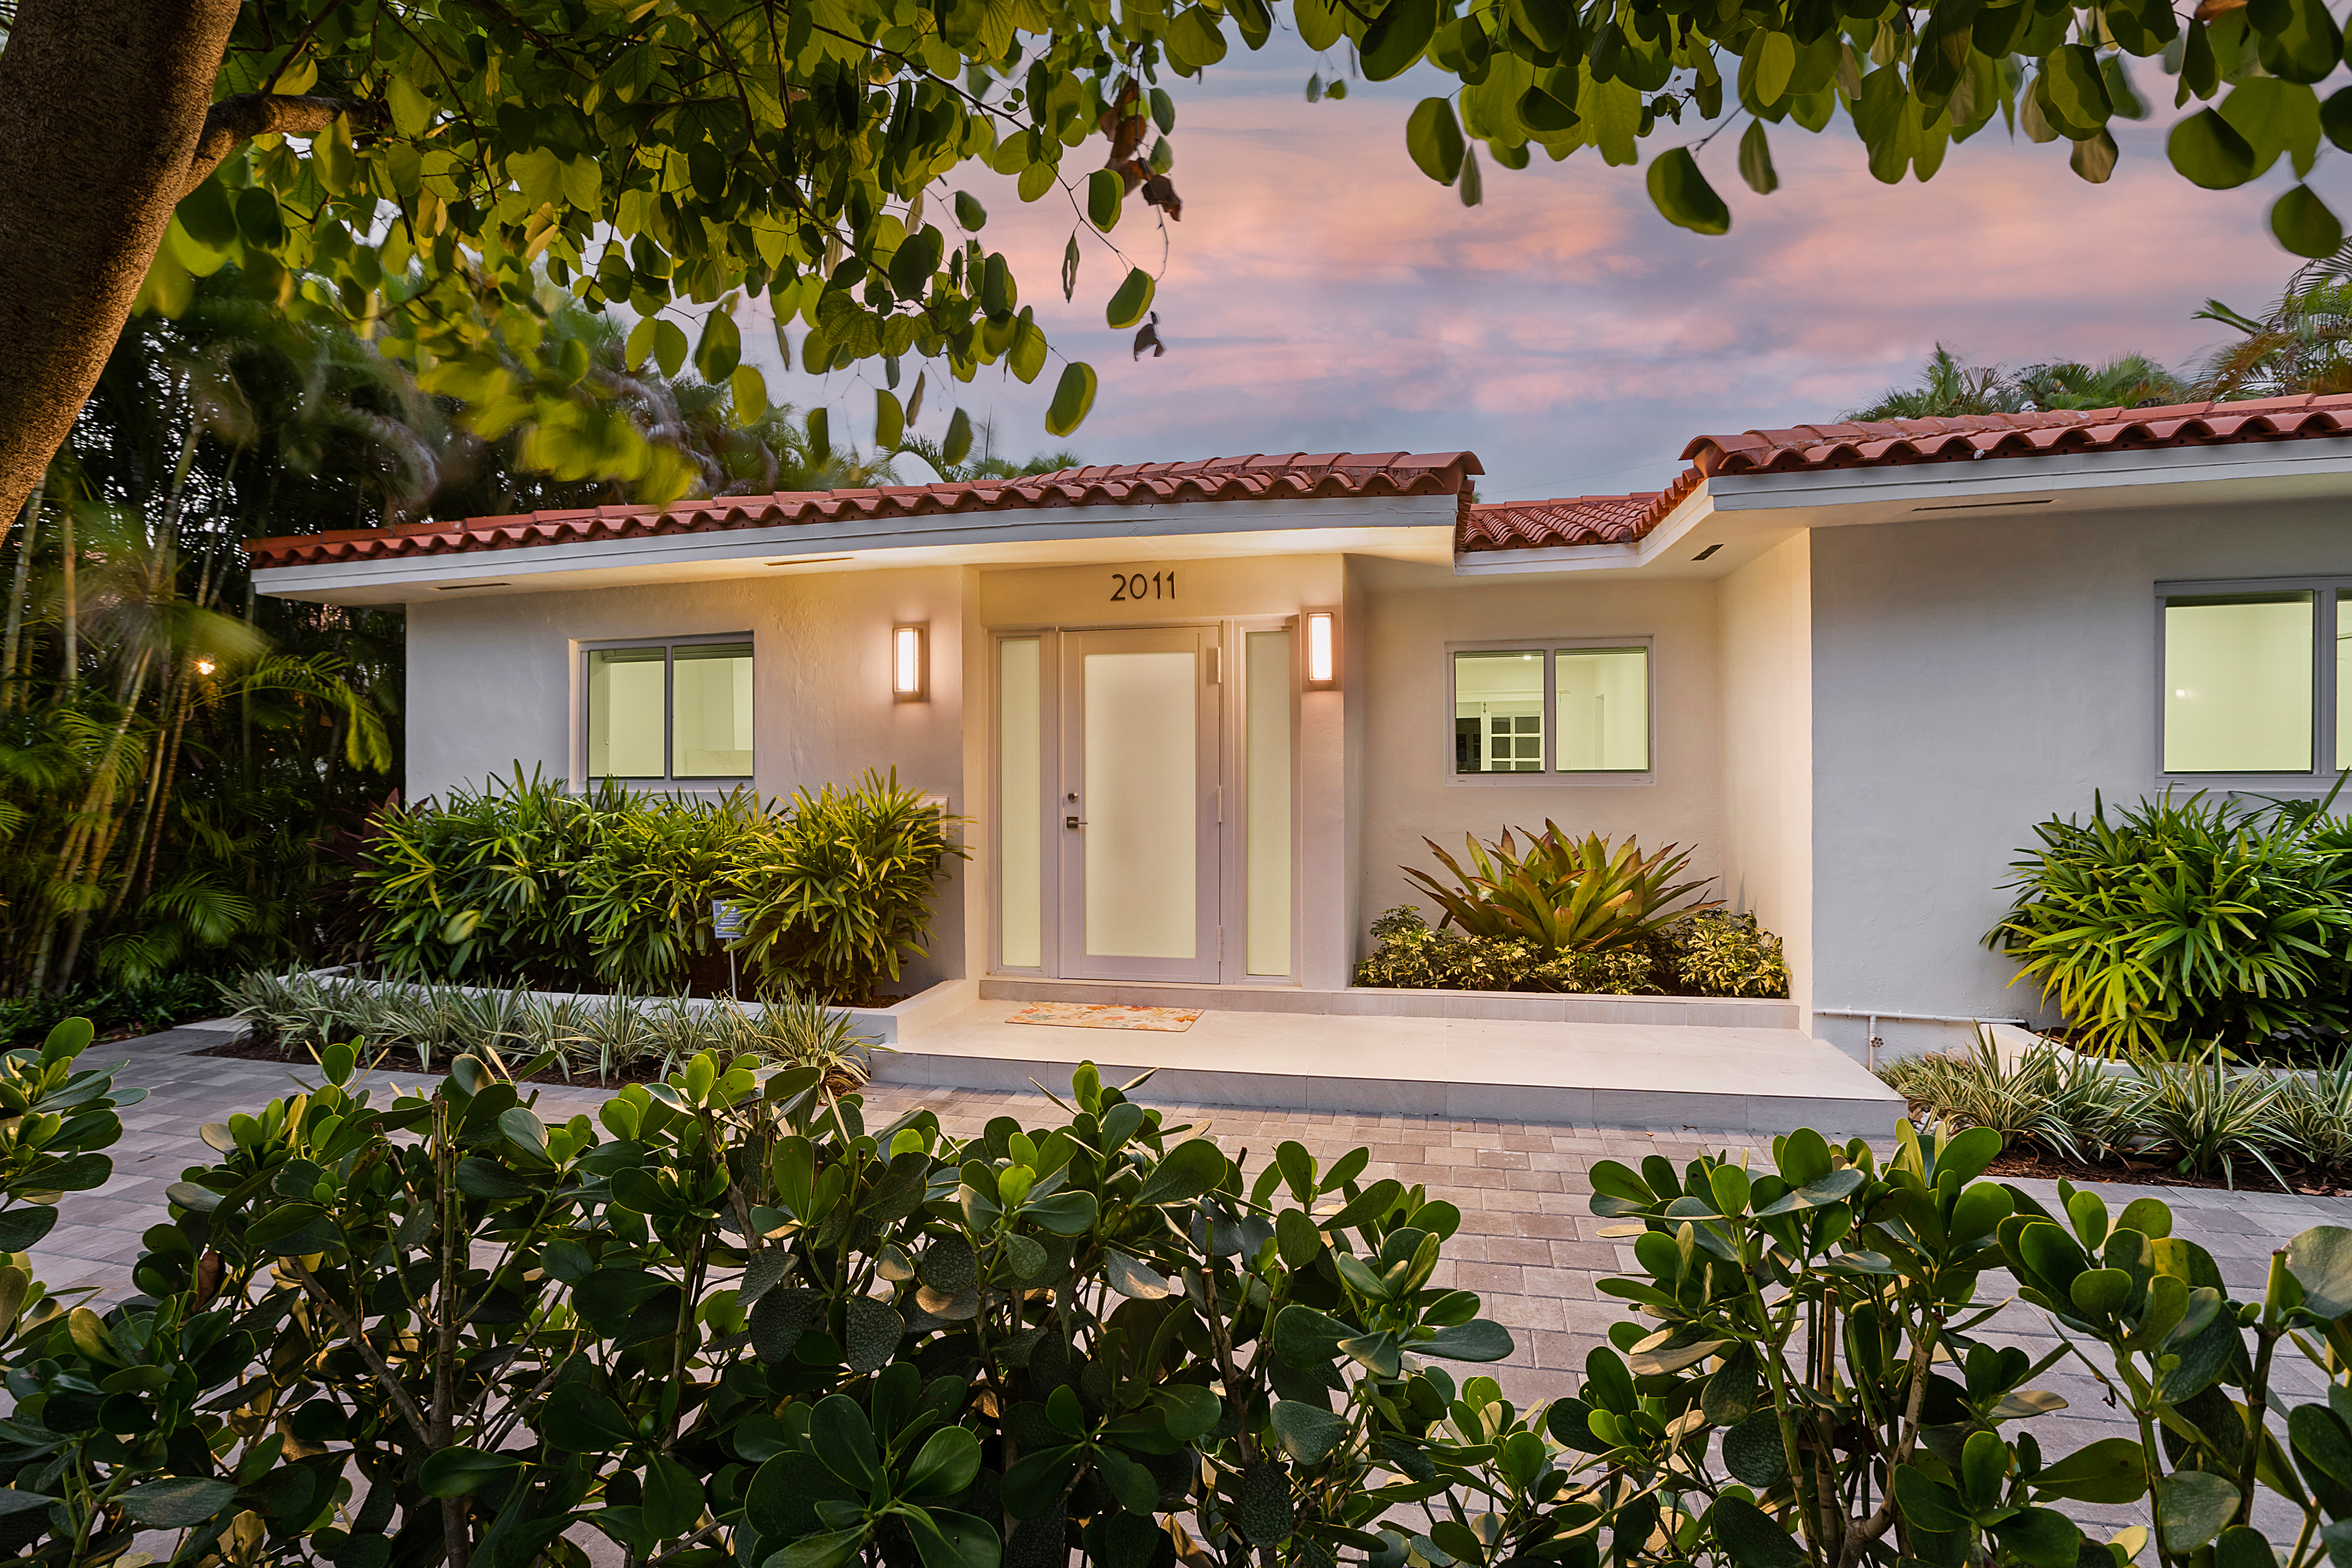
Sold | Listed by Jorge Fernandez
The Shenandoah Guys
Details
Bedrooms
3
Bathrooms
3
Living Area
1,894 sq. ft.
Lot Size
6,960 sq. ft.
Original List Price
$1,195,000
Sale Price
$1,075,000
Closing Date
February 6, 2024
Disclosure
Write-up
FEATURED SHENANDOAH CLOSING
Featured closing

Sold by Jorge Fernandez
Details
Label
Value
Label
Value
Label
Value
Label
Value
Label
Value
Label
Value
Label
Value
Disclosure
Watch Property Video →
Write-up
FEATURED SHENANDOAH CLOSING
Featured closing
Sold by Jorge Fernandez
Details
Label
Value
Label
Value
Label
Value
Label
Value
Label
Value
Label
Value
Label
Value
Disclosure
Watch Property Video →
Write-up
Market Snapshot
Snapshot
How 2024 Compared With 2023
Shenandoah single-family homes
SHENANDOAH SINGLE-FAMILY
2023
2024
CHANGE
SHENANDOAH SINGLE-FAMILY
Closed sales
2023
118
2024
108
CHANGE
↓ 8%
SHENANDOAH SINGLE-FAMILY
Total sales volume
2023
$103.6M
2024
$102.8M
CHANGE
↓ 0.8%
SHENANDOAH SINGLE-FAMILY
Median sold price
2023
$798,000
2024
$879,000
CHANGE
↑ 10.2%
SHENANDOAH SINGLE-FAMILY
Median original asking price
2023
$857,500
2024
$927,500
CHANGE
↑ 8.2%
SHENANDOAH SINGLE-FAMILY
Median price / sq. ft.
2023
$501
2024
$538
CHANGE
↑ 7.4%
SHENANDOAH SINGLE-FAMILY
Sold vs. original list price
2023
92.9%
2024
93.3%
CHANGE
↑ 0.4 pts
SHENANDOAH SINGLE-FAMILY
Sold vs. final list price
2023
96.1%
2024
95.4%
CHANGE
↓ 0.7 pts
SHENANDOAH SINGLE-FAMILY
Median days on market
2023
54
2024
48
CHANGE
↓ 6 days
SHENANDOAH SINGLE-FAMILY
Sales after a price reduction
2023
44%
2024
36%
CHANGE
↓ 8 pts
SHENANDOAH SINGLE-FAMILY
Sold at or above asking
2023
18%
2024
25%
CHANGE
↑ 7 pts
SHENANDOAH SINGLE-FAMILY
Homes listed for sale
2023
163
2024
144
CHANGE
↓ 12%
SHENANDOAH SINGLE-FAMILY
Months of supply (approx.)
2023
4.7
2024
4.8
CHANGE
About even
SHENANDOAH SINGLE-FAMILY
Listings that sold (approx.)
2023
69%
2024
63%
CHANGE
↓ 6 pts
SHENANDOAH SINGLE-FAMILY
Median living area
2023
1,752 sq. ft.
2024
1,714 sq. ft.
CHANGE
↓ 2%
SHENANDOAH SINGLE-FAMILY
Median lot size
2023
6,025 sq. ft.
2024
5,914 sq. ft.
CHANGE
↓ 2%
Approximate figures are estimated from listings that expired or were cancelled without selling; homes relisted and sold within a year are counted as sold.
2024 Month by Month
Swipe sideways to see all columns →
MONTH
CLOSED SALES
MEDIAN SOLD PRICE
MEDIAN $ / SQ. FT.
MEDIAN DAYS ON MARKET
SOLD VS. ORIGINAL LIST
MONTH
January
CLOSED SALES
8
MEDIAN SOLD PRICE
$782,500
MEDIAN $ / SQ. FT.
$462
MEDIAN DAYS ON MARKET
36
SOLD VS. ORIGINAL LIST
90.1%
MONTH
February
CLOSED SALES
8
MEDIAN SOLD PRICE
$837,500
MEDIAN $ / SQ. FT.
$522
MEDIAN DAYS ON MARKET
70
SOLD VS. ORIGINAL LIST
90.3%
MONTH
March
CLOSED SALES
10
MEDIAN SOLD PRICE
$907,500
MEDIAN $ / SQ. FT.
$492
MEDIAN DAYS ON MARKET
38
SOLD VS. ORIGINAL LIST
96.8%
MONTH
April
CLOSED SALES
11
MEDIAN SOLD PRICE
$905,000
MEDIAN $ / SQ. FT.
$511
MEDIAN DAYS ON MARKET
20
SOLD VS. ORIGINAL LIST
94.3%
MONTH
May
CLOSED SALES
9
MEDIAN SOLD PRICE
$899,000
MEDIAN $ / SQ. FT.
$557
MEDIAN DAYS ON MARKET
53
SOLD VS. ORIGINAL LIST
92.8%
MONTH
June
CLOSED SALES
12
MEDIAN SOLD PRICE
$907,500
MEDIAN $ / SQ. FT.
$607
MEDIAN DAYS ON MARKET
80
SOLD VS. ORIGINAL LIST
94.8%
MONTH
July
CLOSED SALES
10
MEDIAN SOLD PRICE
$1,012,500
MEDIAN $ / SQ. FT.
$606
MEDIAN DAYS ON MARKET
41
SOLD VS. ORIGINAL LIST
91.9%
MONTH
August
CLOSED SALES
6
MEDIAN SOLD PRICE
$1,255,000
MEDIAN $ / SQ. FT.
$628
MEDIAN DAYS ON MARKET
70
SOLD VS. ORIGINAL LIST
91.0%
MONTH
September
CLOSED SALES
9
MEDIAN SOLD PRICE
$770,000
MEDIAN $ / SQ. FT.
$624
MEDIAN DAYS ON MARKET
51
SOLD VS. ORIGINAL LIST
89.4%
MONTH
October
CLOSED SALES
8
MEDIAN SOLD PRICE
$799,000
MEDIAN $ / SQ. FT.
$536
MEDIAN DAYS ON MARKET
19
SOLD VS. ORIGINAL LIST
95.4%
MONTH
November
CLOSED SALES
6
MEDIAN SOLD PRICE
$918,000
MEDIAN $ / SQ. FT.
$459
MEDIAN DAYS ON MARKET
44
SOLD VS. ORIGINAL LIST
94.9%
MONTH
December
CLOSED SALES
11
MEDIAN SOLD PRICE
$855,000
MEDIAN $ / SQ. FT.
$513
MEDIAN DAYS ON MARKET
54
SOLD VS. ORIGINAL LIST
94.1%
Closed Sales by Month
2024 · single-family homes
Where Homes Sold: Price Ranges
Closed single-family sales by price range, 2023 vs. 2024
Existing Homes vs. New Construction
Swipe sideways to see all columns →
HOME TYPE
SALES
MEDIAN PRICE
$ / SQ. FT.
MEDIAN DOM
HOME TYPE
Built before 1960
SALES
93
MEDIAN PRICE
$875,000
$ / SQ. FT.
$545
MEDIAN DOM
45
HOME TYPE
Built 1960–2020
SALES
11
MEDIAN PRICE
$830,000
$ / SQ. FT.
$511
MEDIAN DOM
41
HOME TYPE
New construction (2021–2024)
SALES
4
MEDIAN PRICE
$1,722,500
$ / SQ. FT.
$642
MEDIAN DOM
142
Shenandoah Closed Sales, 2024
108 single-family sales · highest price first
Swipe sideways to see all columns →
ADDRESS
CLOSED PRICE ▼
$ / LIVING SQ. FT.
BEDS / BATHS
LIVING SQ. FT.
LOT SQ. FT.
DAYS ON MARKET
SOLD VS. ORIGINAL LIST
CLOSING DATE
ADDRESS
2011 SW 13th St.
CLOSED PRICE
$1,988,000
$ / LIVING SQ. FT.
$674
BEDS / BATHS
4 / 4
LIVING SQ. FT.
2,950
LOT SQ. FT.
7,250
DAYS ON MARKET
201
SOLD VS. ORIGINAL LIST
86.8%
CLOSING DATE
Jul 17
ADDRESS
1509 SW 15th St.
CLOSED PRICE
$1,975,000
$ / LIVING SQ. FT.
$715
BEDS / BATHS
4 / 3.5
LIVING SQ. FT.
2,764
LOT SQ. FT.
5,450
DAYS ON MARKET
158
SOLD VS. ORIGINAL LIST
86.2%
CLOSING DATE
May 6
ADDRESS
1600 SW 14th Ter.
CLOSED PRICE
$1,650,000
$ / LIVING SQ. FT.
$581
BEDS / BATHS
4 / 3.5
LIVING SQ. FT.
2,840
LOT SQ. FT.
6,540
DAYS ON MARKET
11
SOLD VS. ORIGINAL LIST
103.4%
CLOSING DATE
Mar 26
ADDRESS
1511 SW 13th St.
CLOSED PRICE
$1,595,000
$ / LIVING SQ. FT.
$826
BEDS / BATHS
4 / 3
LIVING SQ. FT.
1,931
LOT SQ. FT.
8,625
DAYS ON MARKET
7
SOLD VS. ORIGINAL LIST
100.0%
CLOSING DATE
Feb 2
ADDRESS
2370 SW 17th St.
CLOSED PRICE
$1,530,000
$ / LIVING SQ. FT.
$484
BEDS / BATHS
5 / 3.5
LIVING SQ. FT.
3,164
LOT SQ. FT.
5,450
DAYS ON MARKET
226
SOLD VS. ORIGINAL LIST
90.0%
CLOSING DATE
Aug 1
ADDRESS
1619 SW 17th Ter.
CLOSED PRICE
$1,500,000
$ / LIVING SQ. FT.
BEDS / BATHS
3 / 3
LIVING SQ. FT.
LOT SQ. FT.
5,450
DAYS ON MARKET
40
SOLD VS. ORIGINAL LIST
88.3%
CLOSING DATE
Aug 9
ADDRESS
2356 SW 11th St.
CLOSED PRICE
$1,470,000
$ / LIVING SQ. FT.
$611
BEDS / BATHS
5 / 4
LIVING SQ. FT.
2,407
LOT SQ. FT.
5,850
DAYS ON MARKET
125
SOLD VS. ORIGINAL LIST
84.0%
CLOSING DATE
Jun 28
ADDRESS
1250 SW 17th Ter.
CLOSED PRICE
$1,425,000
$ / LIVING SQ. FT.
$799
BEDS / BATHS
4 / 3
LIVING SQ. FT.
1,784
LOT SQ. FT.
6,240
DAYS ON MARKET
68
SOLD VS. ORIGINAL LIST
89.9%
CLOSING DATE
Jul 31
ADDRESS
1900 SW 18th Ave.
CLOSED PRICE
$1,400,000
$ / LIVING SQ. FT.
$520
BEDS / BATHS
4 / 3
LIVING SQ. FT.
2,694
LOT SQ. FT.
7,363
DAYS ON MARKET
98
SOLD VS. ORIGINAL LIST
93.3%
CLOSING DATE
Jun 18
ADDRESS
1516 SW 18th St.
CLOSED PRICE
$1,400,000
$ / LIVING SQ. FT.
$674
BEDS / BATHS
4 / 3
LIVING SQ. FT.
2,076
LOT SQ. FT.
6,750
DAYS ON MARKET
54
SOLD VS. ORIGINAL LIST
95.6%
CLOSING DATE
Dec 6
ADDRESS
2285 SW 18th St.
CLOSED PRICE
$1,360,000
$ / LIVING SQ. FT.
$628
BEDS / BATHS
4 / 3.5
LIVING SQ. FT.
2,166
LOT SQ. FT.
7,500
DAYS ON MARKET
5
SOLD VS. ORIGINAL LIST
98.9%
CLOSING DATE
Aug 1
ADDRESS
1679 SW 14th Ter.
CLOSED PRICE
$1,350,000
$ / LIVING SQ. FT.
$596
BEDS / BATHS
4 / 3
LIVING SQ. FT.
2,265
LOT SQ. FT.
5,450
DAYS ON MARKET
41
SOLD VS. ORIGINAL LIST
91.5%
CLOSING DATE
Jun 10
ADDRESS
1800 SW 13th Ave.
CLOSED PRICE
$1,325,000
$ / LIVING SQ. FT.
$633
BEDS / BATHS
3 / 2
LIVING SQ. FT.
2,094
LOT SQ. FT.
7,085
DAYS ON MARKET
291
SOLD VS. ORIGINAL LIST
67.9%
CLOSING DATE
Jul 3
ADDRESS
2153 SW 13th St.
CLOSED PRICE
$1,300,000
$ / LIVING SQ. FT.
$454
BEDS / BATHS
4 / 2
LIVING SQ. FT.
2,864
LOT SQ. FT.
7,250
DAYS ON MARKET
7
SOLD VS. ORIGINAL LIST
100.0%
CLOSING DATE
Apr 9
ADDRESS
1671 SW 16th St.
CLOSED PRICE
$1,250,400
$ / LIVING SQ. FT.
$753
BEDS / BATHS
4 / 3
LIVING SQ. FT.
1,661
LOT SQ. FT.
5,450
DAYS ON MARKET
252
SOLD VS. ORIGINAL LIST
80.7%
CLOSING DATE
Sept 3
ADDRESS
1654 SW 18th Ave.
CLOSED PRICE
$1,250,000
$ / LIVING SQ. FT.
$662
BEDS / BATHS
4 / 4
LIVING SQ. FT.
1,888
LOT SQ. FT.
5,564
DAYS ON MARKET
53
SOLD VS. ORIGINAL LIST
96.2%
CLOSING DATE
May 10
ADDRESS
1227 SW 21st Ter.
CLOSED PRICE
$1,250,000
$ / LIVING SQ. FT.
BEDS / BATHS
3 / 2.5
LIVING SQ. FT.
LOT SQ. FT.
5,928
DAYS ON MARKET
126
SOLD VS. ORIGINAL LIST
86.2%
CLOSING DATE
Nov 27
ADDRESS
1414 SW 19th Ave.
CLOSED PRICE
$1,200,000
$ / LIVING SQ. FT.
$345
BEDS / BATHS
4 / 3
LIVING SQ. FT.
3,481
LOT SQ. FT.
15,120
DAYS ON MARKET
77
SOLD VS. ORIGINAL LIST
80.0%
CLOSING DATE
Feb 15
ADDRESS
2459 SW 20th St.
CLOSED PRICE
$1,190,000
$ / LIVING SQ. FT.
$595
BEDS / BATHS
4 / 3
LIVING SQ. FT.
2,001
LOT SQ. FT.
5,500
DAYS ON MARKET
10
SOLD VS. ORIGINAL LIST
95.3%
CLOSING DATE
Jan 8
ADDRESS
1823 SW 18th Ave.
CLOSED PRICE
$1,188,250
$ / LIVING SQ. FT.
$418
BEDS / BATHS
5 / 4
LIVING SQ. FT.
2,842
LOT SQ. FT.
4,916
DAYS ON MARKET
92
SOLD VS. ORIGINAL LIST
95.1%
CLOSING DATE
Oct 22
ADDRESS
1667 SW 11th St.
CLOSED PRICE
$1,155,000
$ / LIVING SQ. FT.
$550
BEDS / BATHS
5 / 3
LIVING SQ. FT.
2,101
LOT SQ. FT.
5,900
DAYS ON MARKET
9
SOLD VS. ORIGINAL LIST
100.4%
CLOSING DATE
Apr 22
ADDRESS
1515 SW 11th St.
CLOSED PRICE
$1,150,000
$ / LIVING SQ. FT.
$594
BEDS / BATHS
4 / 3
LIVING SQ. FT.
1,935
LOT SQ. FT.
5,900
DAYS ON MARKET
71
SOLD VS. ORIGINAL LIST
86.8%
CLOSING DATE
Apr 4
ADDRESS
1871 SW 21st Ter.
CLOSED PRICE
$1,150,000
$ / LIVING SQ. FT.
$870
BEDS / BATHS
3 / 2
LIVING SQ. FT.
1,322
LOT SQ. FT.
6,500
DAYS ON MARKET
112
SOLD VS. ORIGINAL LIST
92.0%
CLOSING DATE
Jun 10
ADDRESS
2330 SW 14th St.
CLOSED PRICE
$1,150,000
$ / LIVING SQ. FT.
$443
BEDS / BATHS
4 / 4.5
LIVING SQ. FT.
2,594
LOT SQ. FT.
5,303
DAYS ON MARKET
75
SOLD VS. ORIGINAL LIST
88.8%
CLOSING DATE
Mar 15
ADDRESS
2263 SW 21st Ter.
CLOSED PRICE
$1,150,000
$ / LIVING SQ. FT.
$625
BEDS / BATHS
3 / 2.5
LIVING SQ. FT.
1,839
LOT SQ. FT.
5,000
DAYS ON MARKET
12
SOLD VS. ORIGINAL LIST
93.9%
CLOSING DATE
Jul 18
ADDRESS
All 108 sales · median
CLOSED PRICE
$879,000
$ / LIVING SQ. FT.
$538
BEDS / BATHS
LIVING SQ. FT.
1,714
LOT SQ. FT.
5,914
DAYS ON MARKET
48
SOLD VS. ORIGINAL LIST
93.3%
CLOSING DATE
Source: Southeast Florida MLS.
How the Month Compared
SHENANDOAH
PRIOR
MONTH
CHANGE
SHENANDOAH
–
PRIOR
–
MONTH
–
CHANGE
–
THE LAST 12 MONTHS
The Last 12 Months in Shenandoah
Chart
Chart
ALL SALES, ROLLING 12 MONTHS
Rolling 12-month figures are calculated from closed MLS sales.
The charts illustrate monthly price fluctuations, while the rolling 12-month figures reflect all qualifying closed sales during the period, providing a broader perspective on Shenandoah’s market.
What 2024 Means for Buyers and Sellers in Shenandoah
SELLERS
For sellers, 2024 rewarded homes that were priced right from the start. Well-presented homes at the right price sold in weeks, while overpriced listings sat, needed reductions or came off the market unsold.
BUYERS
For buyers, 2024 meant fewer choices, especially under $750,000. Waiting for lower rates didn’t pay off: the September dip was short-lived. Buyers who were ready when the right home came along had the best opportunities.
Text
YOUR SHENANDOAH HOME VALUE
Considering Selling a Home in Shenandoah?
Get a personalized valuation informed by current neighborhood sales and firsthand local experience.
Jorge Fernandez | The Shenandoah Guys | SERHANT.
About This Year in Review
This report analyzes single-family home sales and market activity in Shenandoah, Miami, for calendar year 2024, using Southeast Florida MLS data. Jorge Fernandez provides firsthand market analysis and local context to explain the why behind the data and what it means for Shenandoah homeowners, sellers and buyers.
REPORTING PERIOD
January 1 – December 31, 2024
MLS DATA CURRENT AS OF
—
PUBLISHED
—
DATA SOURCE
Southeast Florida MLS
Condominium and townhome sales are not included. Sales referenced may include properties in which Jorge Fernandez/The Shenandoah Guys at SERHANT. Florida LLC did not represent the buyer or seller. Information is provided for market analysis purposes.

REPORT PREPARED BY
Jorge Fernandez, REALTOR®
The Shenandoah Guys | SERHANT. Florida
Professional Recognition & Designations
2026 RealTrends Verified | Top 1.5% Nationwide
Certified Luxury Home Marketing Specialist (CLHMS™) | Million Dollar GUILD™
Master Brokers Forum | Advisory Board
Local Expertise
Miami Native | 21+ Years of Real Estate Experience | 10-Year Shenandoah Resident
Florida Real Estate License #SL3158278
Florida Real Estate License #SL3158278
The Shenandoah Guys | SERHANT. Florida
Miami Native | 21+ Years of Real Estate Experience | 10-Year Shenandoah Resident
← PREVIOUS REPORT
NEXT REPORT →