
YOUR NEIGHBORS IN REAL ESTATE


Hablamos Español


YEAR IN REVIEW
Shenandoah Miami Real Estate: 2023 Year in Review
By Jorge Fernandez, REALTOR®
Market data and analysis from Jorge Fernandez, Shenandoah resident and local real estate market expert, with The Shenandoah Guys at SERHANT.
A full-year look at Shenandoah single-family sales in 2023: prices, pace, negotiating power and how our neighborhood’s market changed compared with 2022.
2023 Shenandoah Real Estate at a Glance
Single-family homes · Southeast Florida MLS · Change vs. 2022
LABEL
—
—
LABEL
—
—
LABEL
—
—
LABEL
—
—
LABEL
—
—
Months of inventory
Calculation
MEDIAN SALE PRICE
$798,000
↑ 5.0% vs. 2022
MEDIAN SOLD $ / SQ. FT.
$501
↑ 8.9% vs. 2022
CLOSED SALES
118
↑ 11 vs. 2022
TOTAL SALES VOLUME
$103.6M
↑ 15.6% vs. 2022
SOLD VS. ORIGINAL LIST PRICE
92.9%
↓ 4.3 pts vs. 2022
MEDIAN DAYS ON MARKET
54
↑ 26 days vs. 2022
MARKET ACTIVITY
163
Homes Listed for Sale
↑ 3 vs. 2022
96.1%
Sold vs. Final List Price
↓ 2.5 pts vs. 2022
44%
Sold After Price Reduction
↑ 18 pts vs. 2022
—
Label
—
Label
Year to date
The 2023 Shenandoah Market in Review
If 2021 and 2022 were about speed, 2023 was the year Shenandoah’s market reset. Buyers slowed down and started negotiating again, yet our neighborhood still had one of its strongest years on record. 118 single-family homes closed, up from 107 in 2022, even as single-family sales across Miami-Dade County fell 14%. Total sales volume reached $103.6 million, the highest of any year since at least 2016. The median sale price rose 5.0% to $798,000, and the median price per square foot rose 8.9% to $501, crossing $500 for the first time.
The backdrop was the steepest climb in borrowing costs in a generation. The Federal Reserve kept raising rates through July, bringing its benchmark rate to its highest level in 22 years. Thirty-year mortgage rates followed, peaking at 7.79% in late October, the highest in more than two decades, before easing to about 6.6% by December. Add the regional bank failures in the spring and steep increases in homeowners insurance costs across Florida, and buyers became far more cautious about what they would pay. Many of our neighbors with low-rate mortgages chose to stay put, which kept the number of homes for sale in check.
The biggest change I noticed was in negotiating power. In 2022, homes sold in a median of 28 days, and 43% sold at or above asking. In 2023, the median time on market nearly doubled to 54 days, only 18% sold at or above asking, and 44% of sales needed a price reduction, up from 26%. The typical home sold at 92.9% of its original list price, down from 97.2%. Prices held up, but sellers who priced for 2022 conditions found themselves chasing the market.
At the top of the market, new construction set the pace. Shenandoah’s two highest sales were both newly built homes: 2134 SW 10th Street at $2,200,000 and 2015 SW 13th Street at $2,050,000. Sales of $1 million and above rose to 30, a quarter of the market. Featured below are two of my 2023 closings in our neighborhood: 2214 SW 17th Terrace, which sold in July for $796,000, and 2177 SW 12th Street, which sold in October for $1,275,000.
2023 was a memorable year for the neighborhood itself. In February, the Miami Shenandoah Neighborhood Association organized a historic walking tour of Shenandoah with historian Dr. Paul George of HistoryMiami, exploring the stories behind our homes and streets. And in June, I attended the grand opening of the new Shenandoah Park Pool & Aquatic Center, part of a roughly $9 million redevelopment of Shenandoah Park that added an Olympic-size pool, new locker rooms, walking trails and a rebuilt basketball court.
Shenandoah Since 2016: The Long-Term Trend
2016 – 2023 · single-family homes · one point per year
Median Sale Price
Full-year median, 2016–2023
Median Price per Sq. Ft.
Full-year median, 2016–2023
Closed Sales per Year
Single-family homes
Sold vs. Original List Price
Median, as a percent of original asking price
FEATURED 2023 CLOSINGS
2214 SW 17th Terrace, Miami
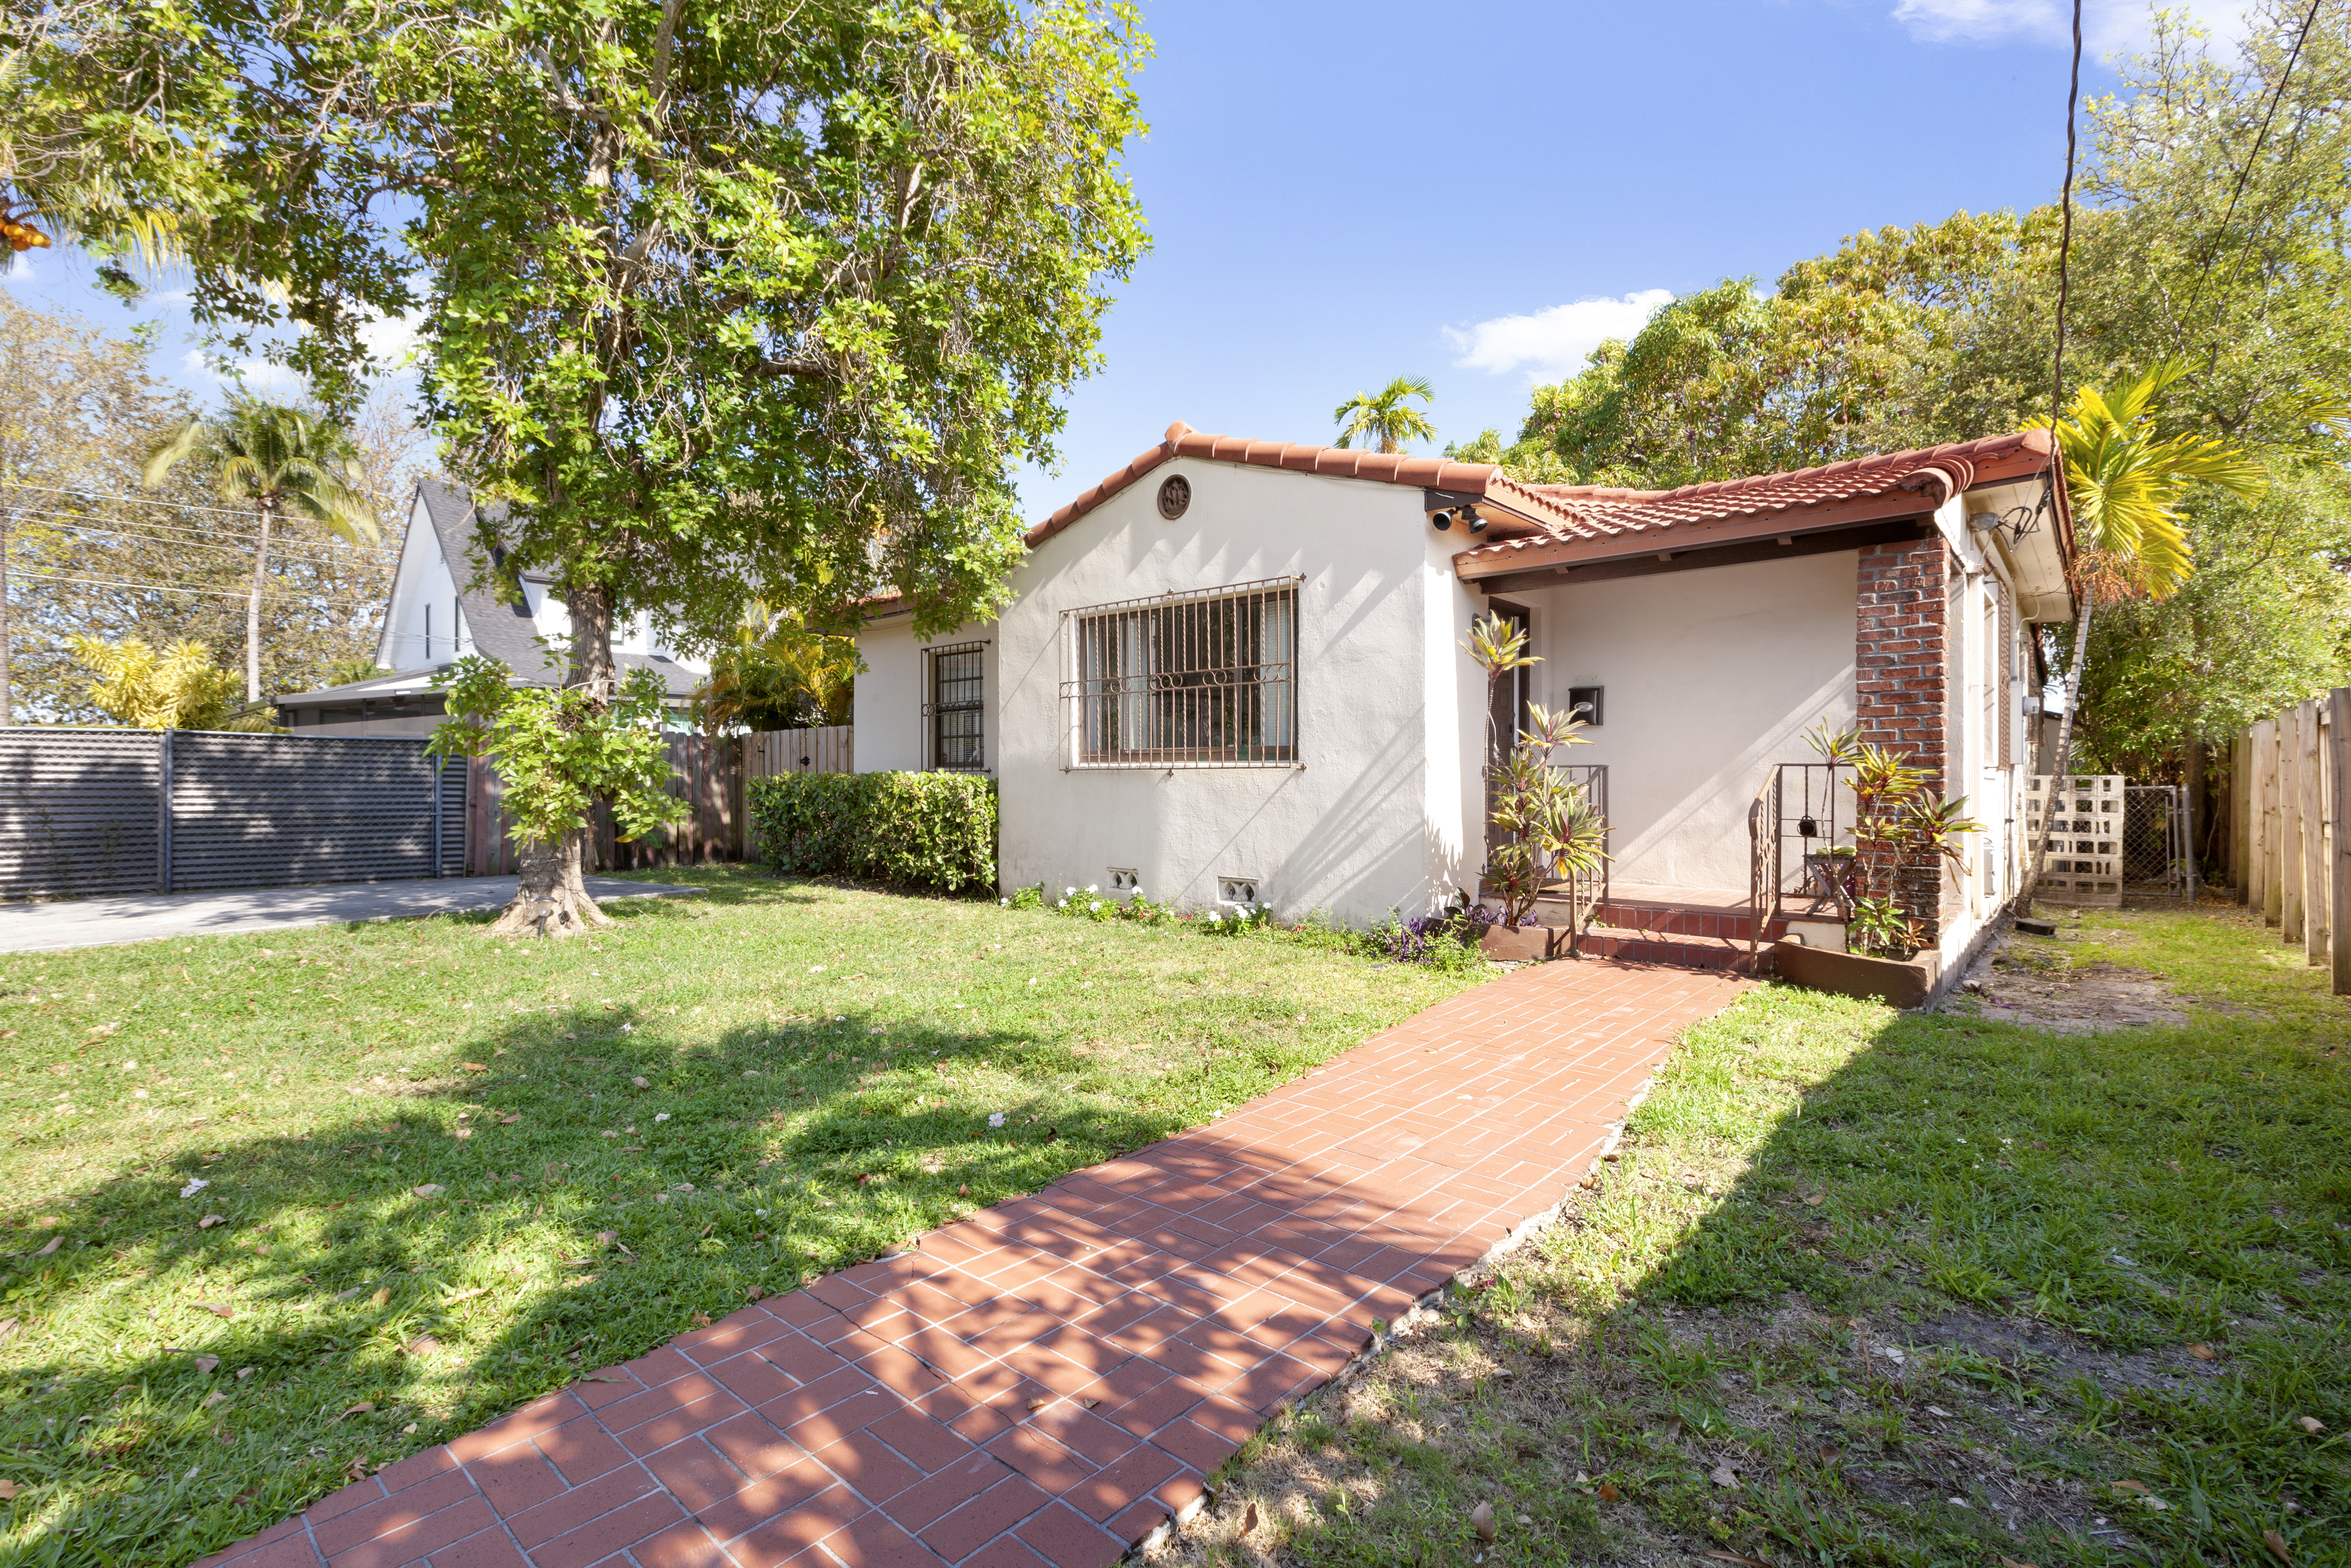
Sold | Listed by Jorge Fernandez
The Shenandoah Guys
Details
Bedrooms
3
Bathrooms
2
Living Area
1,583 sq. ft.
Lot Size
7,500 sq. ft.
Original List Price
$800,000
Sale Price
$796,000
Closing Date
July 24, 2023
Disclosure
Watch Property Video →
Write-up
FEATURED SHENANDOAH CLOSING
2177 SW 12th Street, Miami
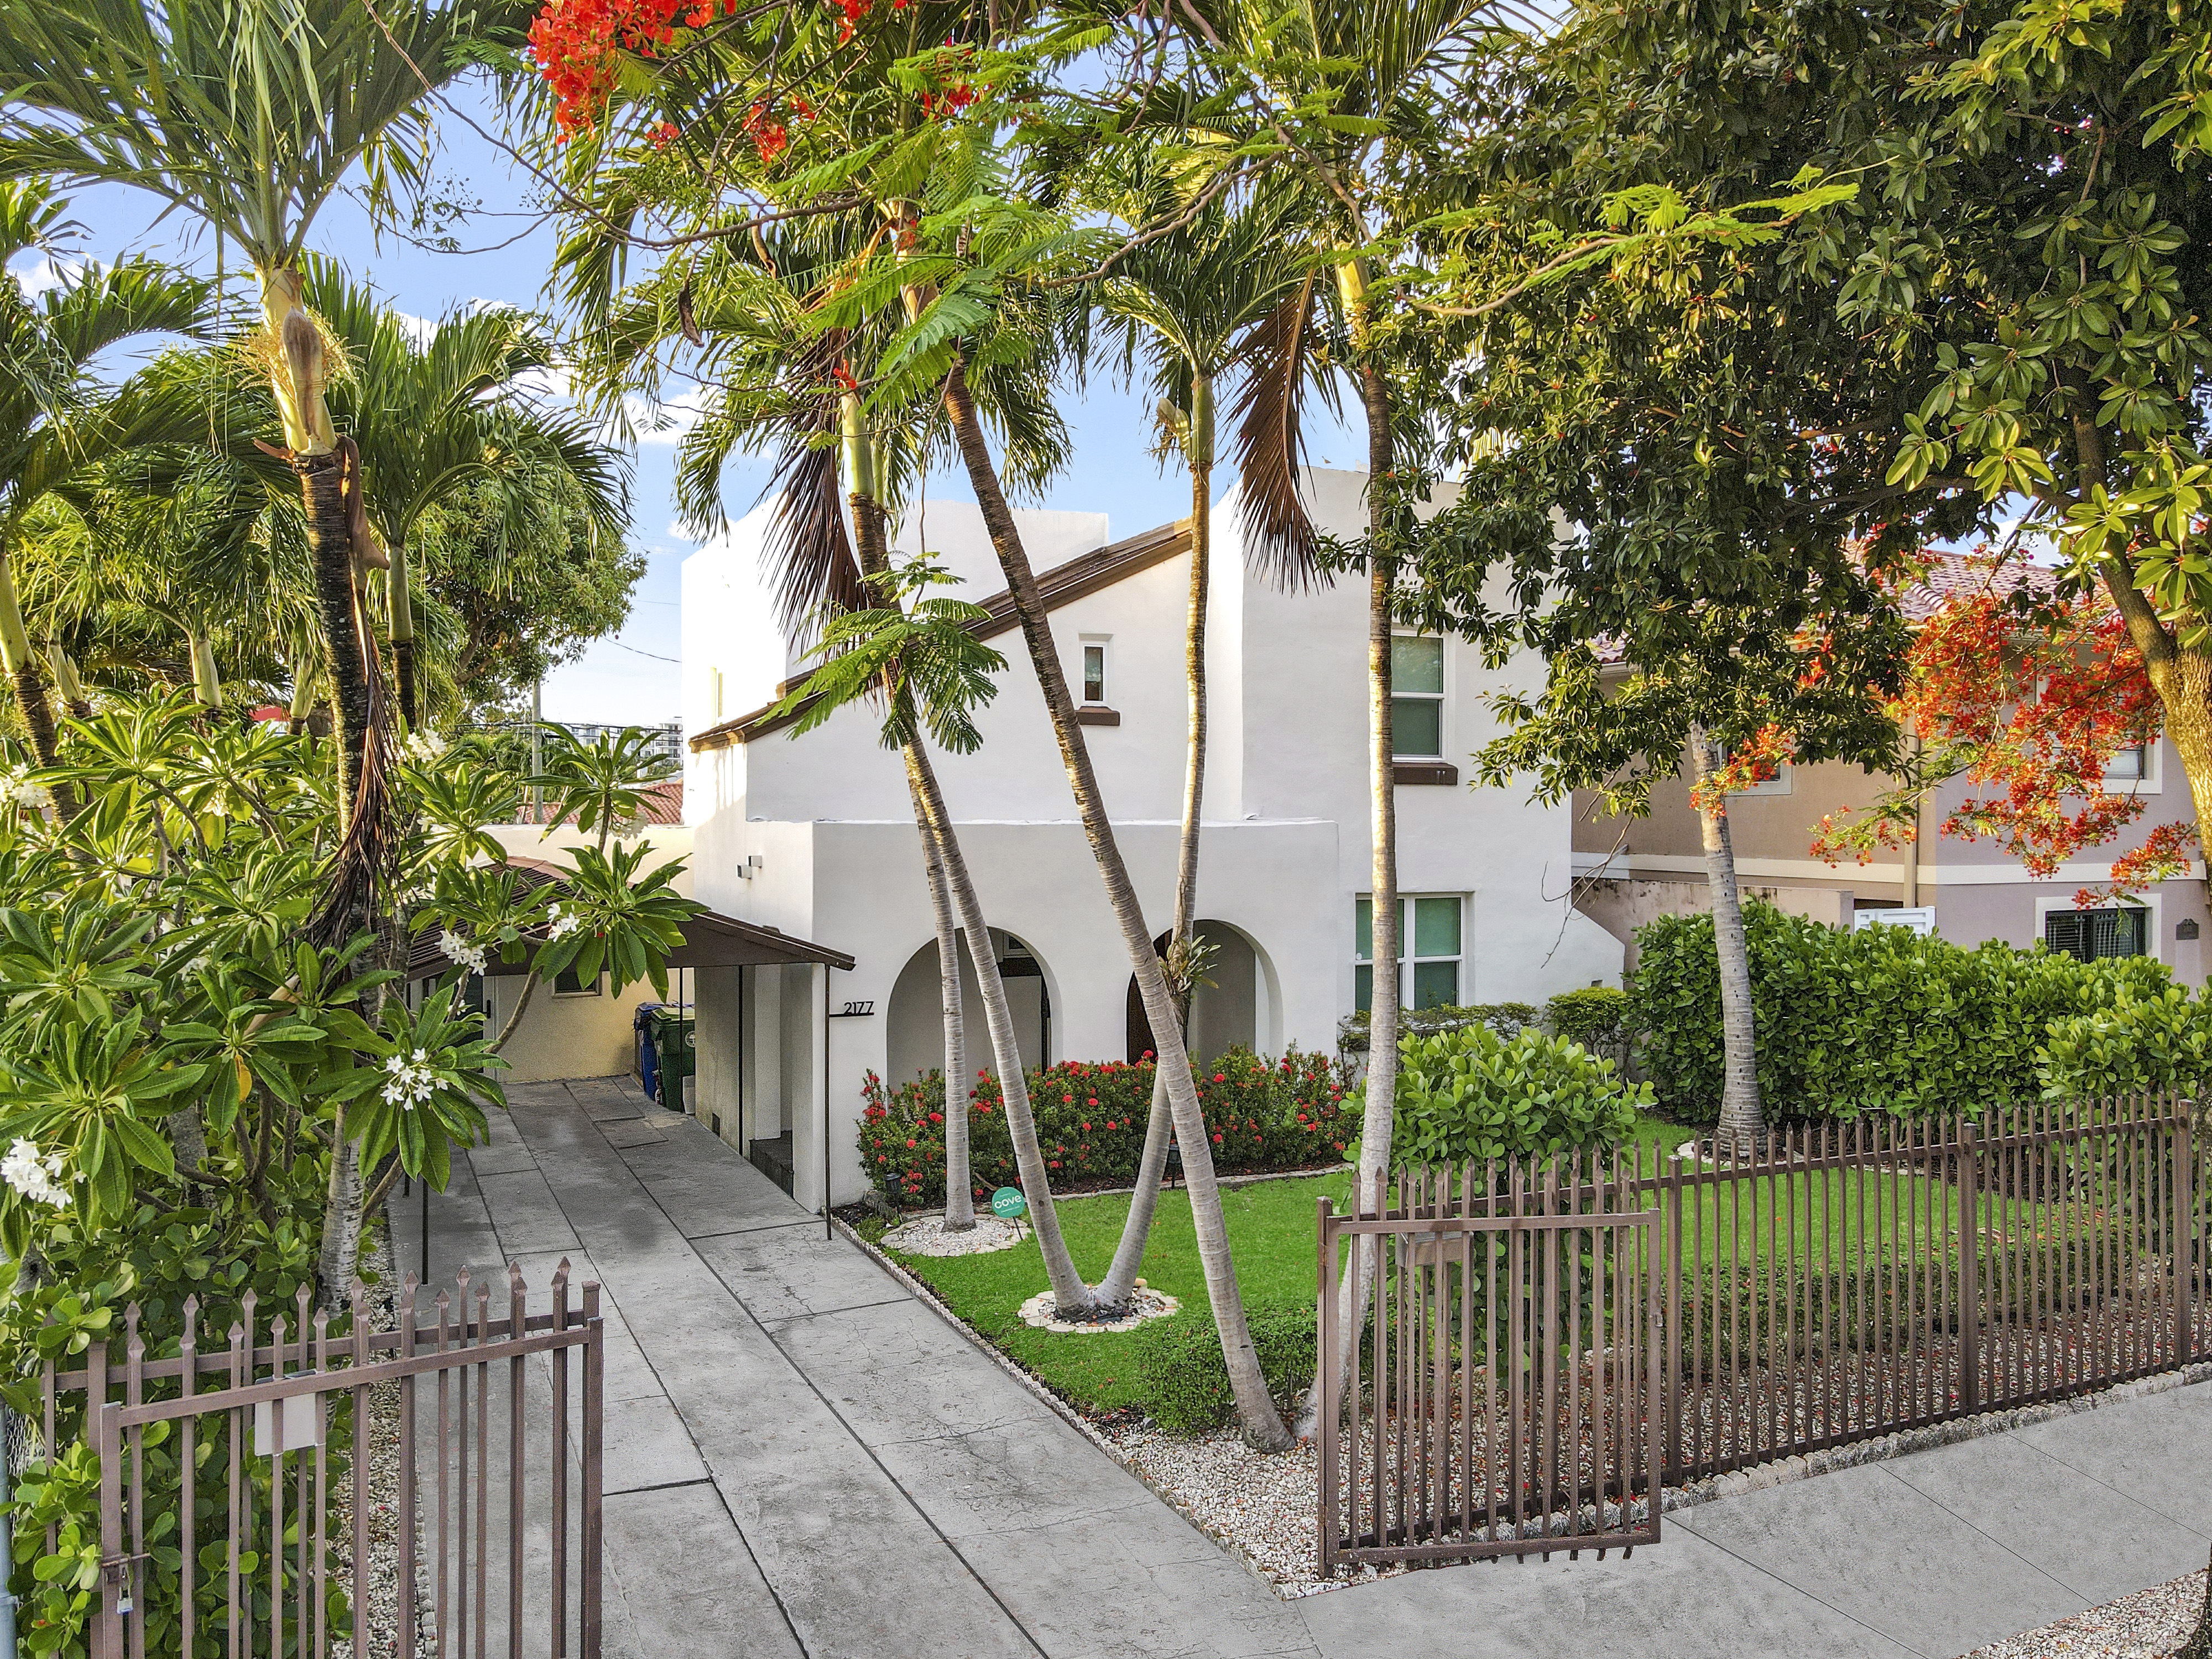
Sold | Listed by Jorge Fernandez
The Shenandoah Guys
Details
Bedrooms
5
Bathrooms
3
Living Area
2,560 sq. ft.
Lot Size
5,600 sq. ft.
Original List Price
$1,500,000
Sale Price
$1,275,000
Closing Date
October 6, 2023
Disclosure
Write-up
FEATURED SHENANDOAH CLOSING
Featured closing

Sold by Jorge Fernandez
Details
Label
Value
Label
Value
Label
Value
Label
Value
Label
Value
Label
Value
Label
Value
Disclosure
Watch Property Video →
Write-up
Market Snapshot
Snapshot
How 2023 Compared With 2022
Shenandoah single-family homes
SHENANDOAH SINGLE-FAMILY
2022
2023
CHANGE
SHENANDOAH SINGLE-FAMILY
Closed sales
2022
107
2023
118
CHANGE
↑ 10%
SHENANDOAH SINGLE-FAMILY
Total sales volume
2022
$89.6M
2023
$103.6M
CHANGE
↑ 15.6%
SHENANDOAH SINGLE-FAMILY
Median sold price
2022
$760,000
2023
$798,000
CHANGE
↑ 5.0%
SHENANDOAH SINGLE-FAMILY
Median original asking price
2022
$799,500
2023
$857,500
CHANGE
↑ 7.3%
SHENANDOAH SINGLE-FAMILY
Median price / sq. ft.
2022
$460
2023
$501
CHANGE
↑ 8.9%
SHENANDOAH SINGLE-FAMILY
Sold vs. original list price
2022
97.2%
2023
92.9%
CHANGE
↓ 4.3 pts
SHENANDOAH SINGLE-FAMILY
Sold vs. final list price
2022
98.6%
2023
96.1%
CHANGE
↓ 2.5 pts
SHENANDOAH SINGLE-FAMILY
Median days on market
2022
28
2023
54
CHANGE
↑ 26 days
SHENANDOAH SINGLE-FAMILY
Sales after a price reduction
2022
26%
2023
44%
CHANGE
↑ 18 pts
SHENANDOAH SINGLE-FAMILY
Sold at or above asking
2022
43%
2023
18%
CHANGE
↓ 25 pts
SHENANDOAH SINGLE-FAMILY
Homes listed for sale
2022
160
2023
163
CHANGE
↑ 2%
SHENANDOAH SINGLE-FAMILY
Months of supply (approx.)
2022
5.1
2023
4.7
CHANGE
↓ 0.4
SHENANDOAH SINGLE-FAMILY
Listings that sold (approx.)
2022
71%
2023
69%
CHANGE
↓ 2 pts
SHENANDOAH SINGLE-FAMILY
Median living area
2022
1,742 sq. ft.
2023
1,752 sq. ft.
CHANGE
↑ 1%
SHENANDOAH SINGLE-FAMILY
Median lot size
2022
5,900 sq. ft.
2023
6,025 sq. ft.
CHANGE
↑ 2%
Approximate figures are estimated from listings that expired or were cancelled without selling; homes relisted and sold within a year are counted as sold.
2023 Month by Month
Swipe sideways to see all columns →
MONTH
CLOSED SALES
MEDIAN SOLD PRICE
MEDIAN $ / SQ. FT.
MEDIAN DAYS ON MARKET
SOLD VS. ORIGINAL LIST
MONTH
January
CLOSED SALES
9
MEDIAN SOLD PRICE
$785,000
MEDIAN $ / SQ. FT.
$382
MEDIAN DAYS ON MARKET
98
SOLD VS. ORIGINAL LIST
88.8%
MONTH
February
CLOSED SALES
8
MEDIAN SOLD PRICE
$1,007,500
MEDIAN $ / SQ. FT.
$554
MEDIAN DAYS ON MARKET
111
SOLD VS. ORIGINAL LIST
88.4%
MONTH
March
CLOSED SALES
14
MEDIAN SOLD PRICE
$820,000
MEDIAN $ / SQ. FT.
$512
MEDIAN DAYS ON MARKET
52
SOLD VS. ORIGINAL LIST
94.8%
MONTH
April
CLOSED SALES
7
MEDIAN SOLD PRICE
$690,000
MEDIAN $ / SQ. FT.
$501
MEDIAN DAYS ON MARKET
37
SOLD VS. ORIGINAL LIST
92.8%
MONTH
May
CLOSED SALES
8
MEDIAN SOLD PRICE
$717,500
MEDIAN $ / SQ. FT.
$494
MEDIAN DAYS ON MARKET
86
SOLD VS. ORIGINAL LIST
92.4%
MONTH
June
CLOSED SALES
9
MEDIAN SOLD PRICE
$1,040,000
MEDIAN $ / SQ. FT.
$511
MEDIAN DAYS ON MARKET
69
SOLD VS. ORIGINAL LIST
93.4%
MONTH
July
CLOSED SALES
10
MEDIAN SOLD PRICE
$773,000
MEDIAN $ / SQ. FT.
$457
MEDIAN DAYS ON MARKET
51
SOLD VS. ORIGINAL LIST
95.4%
MONTH
August
CLOSED SALES
13
MEDIAN SOLD PRICE
$815,000
MEDIAN $ / SQ. FT.
$554
MEDIAN DAYS ON MARKET
33
SOLD VS. ORIGINAL LIST
96.4%
MONTH
September
CLOSED SALES
12
MEDIAN SOLD PRICE
$722,500
MEDIAN $ / SQ. FT.
$475
MEDIAN DAYS ON MARKET
18
SOLD VS. ORIGINAL LIST
97.3%
MONTH
October
CLOSED SALES
9
MEDIAN SOLD PRICE
$955,000
MEDIAN $ / SQ. FT.
$482
MEDIAN DAYS ON MARKET
56
SOLD VS. ORIGINAL LIST
92.5%
MONTH
November
CLOSED SALES
7
MEDIAN SOLD PRICE
$775,000
MEDIAN $ / SQ. FT.
$541
MEDIAN DAYS ON MARKET
12
SOLD VS. ORIGINAL LIST
98.0%
MONTH
December
CLOSED SALES
12
MEDIAN SOLD PRICE
$687,500
MEDIAN $ / SQ. FT.
$468
MEDIAN DAYS ON MARKET
69
SOLD VS. ORIGINAL LIST
86.3%
Closed Sales by Month
2023 · single-family homes
Where Homes Sold: Price Ranges
Closed single-family sales by price range, 2022 vs. 2023
Existing Homes vs. New Construction
Swipe sideways to see all columns →
HOME TYPE
SALES
MEDIAN PRICE
$ / SQ. FT.
MEDIAN DOM
HOME TYPE
Built before 1960
SALES
104
MEDIAN PRICE
$790,000
$ / SQ. FT.
$503
MEDIAN DOM
45
HOME TYPE
Built 1960–2019
SALES
8
MEDIAN PRICE
$903,500
$ / SQ. FT.
$431
MEDIAN DOM
89
HOME TYPE
New construction (2020–2023)
SALES
6
MEDIAN PRICE
$1,165,000
$ / SQ. FT.
$534
MEDIAN DOM
120
Shenandoah Closed Sales, 2023
118 single-family sales · highest price first
Swipe sideways to see all columns →
ADDRESS
CLOSED PRICE ▼
$ / LIVING SQ. FT.
BEDS / BATHS
LIVING SQ. FT.
LOT SQ. FT.
DAYS ON MARKET
SOLD VS. ORIGINAL LIST
CLOSING DATE
ADDRESS
2134 SW 10th St.
CLOSED PRICE
$2,200,000
$ / LIVING SQ. FT.
$764
BEDS / BATHS
4 / 3.5
LIVING SQ. FT.
2,880
LOT SQ. FT.
8,142
DAYS ON MARKET
196
SOLD VS. ORIGINAL LIST
92.1%
CLOSING DATE
Aug 28
ADDRESS
2015 SW 13th St.
CLOSED PRICE
$2,050,000
$ / LIVING SQ. FT.
$534
BEDS / BATHS
4 / 4
LIVING SQ. FT.
3,841
LOT SQ. FT.
7,250
DAYS ON MARKET
146
SOLD VS. ORIGINAL LIST
89.1%
CLOSING DATE
Oct 31
ADDRESS
1004 SW 16th Ave.
CLOSED PRICE
$1,980,000
$ / LIVING SQ. FT.
$758
BEDS / BATHS
3 / 3.5
LIVING SQ. FT.
2,612
LOT SQ. FT.
9,118
DAYS ON MARKET
7
SOLD VS. ORIGINAL LIST
100.0%
CLOSING DATE
Oct 20
ADDRESS
1700 SW 12th Ave.
CLOSED PRICE
$1,820,000
$ / LIVING SQ. FT.
$563
BEDS / BATHS
5 / 4
LIVING SQ. FT.
3,234
LOT SQ. FT.
9,589
DAYS ON MARKET
102
SOLD VS. ORIGINAL LIST
86.7%
CLOSING DATE
Jul 31
ADDRESS
1828 SW 14th Ter.
CLOSED PRICE
$1,460,000
$ / LIVING SQ. FT.
$481
BEDS / BATHS
6 / 5.5
LIVING SQ. FT.
3,033
LOT SQ. FT.
8,025
DAYS ON MARKET
16
SOLD VS. ORIGINAL LIST
100.7%
CLOSING DATE
Aug 11
ADDRESS
1885 SW 18th St.
CLOSED PRICE
$1,390,000
$ / LIVING SQ. FT.
$570
BEDS / BATHS
5 / 3
LIVING SQ. FT.
2,438
LOT SQ. FT.
11,881
DAYS ON MARKET
45
SOLD VS. ORIGINAL LIST
99.4%
CLOSING DATE
Sept 13
ADDRESS
1120 SW 13th Ave.
CLOSED PRICE
$1,375,000
$ / LIVING SQ. FT.
BEDS / BATHS
4 / 4
LIVING SQ. FT.
LOT SQ. FT.
3,375
DAYS ON MARKET
26
SOLD VS. ORIGINAL LIST
104.2%
CLOSING DATE
Nov 8
ADDRESS
2425 SW 20th St.
CLOSED PRICE
$1,345,000
$ / LIVING SQ. FT.
$557
BEDS / BATHS
4 / 3
LIVING SQ. FT.
2,413
LOT SQ. FT.
8,250
DAYS ON MARKET
30
SOLD VS. ORIGINAL LIST
89.7%
CLOSING DATE
Feb 28
ADDRESS
2004 SW 13th St.
CLOSED PRICE
$1,300,000
$ / LIVING SQ. FT.
$461
BEDS / BATHS
4 / 3
LIVING SQ. FT.
2,821
LOT SQ. FT.
7,300
DAYS ON MARKET
82
SOLD VS. ORIGINAL LIST
92.9%
CLOSING DATE
Feb 8
ADDRESS
1234 SW 19th Ave.
CLOSED PRICE
$1,300,000
$ / LIVING SQ. FT.
$459
BEDS / BATHS
4 / 3
LIVING SQ. FT.
2,833
LOT SQ. FT.
5,989
DAYS ON MARKET
117
SOLD VS. ORIGINAL LIST
100.4%
CLOSING DATE
Mar 10
ADDRESS
1375 SW 17th Ter.
CLOSED PRICE
$1,298,500
$ / LIVING SQ. FT.
$382
BEDS / BATHS
4 / 3
LIVING SQ. FT.
3,395
LOT SQ. FT.
13,680
DAYS ON MARKET
37
SOLD VS. ORIGINAL LIST
122.6%
CLOSING DATE
Jun 9
ADDRESS
2177 SW 12th St. FEATURED SOLD BY JORGE ▶︎ Video
CLOSED PRICE
$1,275,000
$ / LIVING SQ. FT.
$498
BEDS / BATHS
5 / 3
LIVING SQ. FT.
2,560
LOT SQ. FT.
5,600
DAYS ON MARKET
89
SOLD VS. ORIGINAL LIST
85.0%
CLOSING DATE
Oct 6
ADDRESS
1876 SW 11th St.
CLOSED PRICE
$1,250,000
$ / LIVING SQ. FT.
$651
BEDS / BATHS
3 / 2
LIVING SQ. FT.
1,920
LOT SQ. FT.
5,900
DAYS ON MARKET
32
SOLD VS. ORIGINAL LIST
96.5%
CLOSING DATE
Jul 24
ADDRESS
2375 SW 11th Ter.
CLOSED PRICE
$1,205,000
$ / LIVING SQ. FT.
$531
BEDS / BATHS
3 / 3
LIVING SQ. FT.
2,268
LOT SQ. FT.
6,000
DAYS ON MARKET
20
SOLD VS. ORIGINAL LIST
92.8%
CLOSING DATE
Apr 21
ADDRESS
1868 SW 16th St.
CLOSED PRICE
$1,190,000
$ / LIVING SQ. FT.
$679
BEDS / BATHS
3 / 2
LIVING SQ. FT.
1,752
LOT SQ. FT.
5,450
DAYS ON MARKET
9
SOLD VS. ORIGINAL LIST
100.0%
CLOSING DATE
Apr 17
ADDRESS
1457 SW 17th Ter.
CLOSED PRICE
$1,170,000
$ / LIVING SQ. FT.
$558
BEDS / BATHS
3 / 3
LIVING SQ. FT.
2,098
LOT SQ. FT.
5,450
DAYS ON MARKET
2
SOLD VS. ORIGINAL LIST
100.0%
CLOSING DATE
Nov 1
ADDRESS
1728 SW 12th St.
CLOSED PRICE
$1,145,000
$ / LIVING SQ. FT.
$431
BEDS / BATHS
4 / 4
LIVING SQ. FT.
2,654
LOT SQ. FT.
5,900
DAYS ON MARKET
96
SOLD VS. ORIGINAL LIST
76.4%
CLOSING DATE
Nov 27
ADDRESS
2101 SW 13th Ave.
CLOSED PRICE
$1,125,000
$ / LIVING SQ. FT.
$507
BEDS / BATHS
3 / 3
LIVING SQ. FT.
2,220
LOT SQ. FT.
5,928
DAYS ON MARKET
22
SOLD VS. ORIGINAL LIST
91.8%
CLOSING DATE
Jun 12
ADDRESS
2320 SW 14th St.
CLOSED PRICE
$1,125,000
$ / LIVING SQ. FT.
$433
BEDS / BATHS
4 / 4.5
LIVING SQ. FT.
2,600
LOT SQ. FT.
5,325
DAYS ON MARKET
93
SOLD VS. ORIGINAL LIST
90.0%
CLOSING DATE
Jul 28
ADDRESS
1724 SW 10th St.
CLOSED PRICE
$1,125,000
$ / LIVING SQ. FT.
$481
BEDS / BATHS
4 / 3
LIVING SQ. FT.
2,340
LOT SQ. FT.
5,900
DAYS ON MARKET
66
SOLD VS. ORIGINAL LIST
97.9%
CLOSING DATE
Jul 17
ADDRESS
2121 SW 15th St.
CLOSED PRICE
$1,125,000
$ / LIVING SQ. FT.
$716
BEDS / BATHS
3 / 2
LIVING SQ. FT.
1,572
LOT SQ. FT.
6,138
DAYS ON MARKET
194
SOLD VS. ORIGINAL LIST
83.3%
CLOSING DATE
Mar 1
ADDRESS
1724 SW 10th St.
CLOSED PRICE
$1,110,000
$ / LIVING SQ. FT.
$474
BEDS / BATHS
4 / 3
LIVING SQ. FT.
2,340
LOT SQ. FT.
5,900
DAYS ON MARKET
56
SOLD VS. ORIGINAL LIST
92.5%
CLOSING DATE
Oct 31
ADDRESS
1525 SW 13th Ave.
CLOSED PRICE
$1,080,000
$ / LIVING SQ. FT.
$616
BEDS / BATHS
3 / 2
LIVING SQ. FT.
1,753
LOT SQ. FT.
5,750
DAYS ON MARKET
168
SOLD VS. ORIGINAL LIST
83.1%
CLOSING DATE
Jun 9
ADDRESS
1521 SW 16th St.
CLOSED PRICE
$1,075,000
$ / LIVING SQ. FT.
$616
BEDS / BATHS
3 / 2
LIVING SQ. FT.
1,744
LOT SQ. FT.
5,450
DAYS ON MARKET
69
SOLD VS. ORIGINAL LIST
89.6%
CLOSING DATE
Jun 28
ADDRESS
1136 SW 19th Ave.
CLOSED PRICE
$1,075,000
$ / LIVING SQ. FT.
$599
BEDS / BATHS
4 / 3
LIVING SQ. FT.
1,796
LOT SQ. FT.
7,100
DAYS ON MARKET
10
SOLD VS. ORIGINAL LIST
89.6%
CLOSING DATE
Aug 4
ADDRESS
All 118 sales · median
CLOSED PRICE
$798,000
$ / LIVING SQ. FT.
$501
BEDS / BATHS
LIVING SQ. FT.
1,752
LOT SQ. FT.
6,025
DAYS ON MARKET
54
SOLD VS. ORIGINAL LIST
92.9%
CLOSING DATE
Source: Southeast Florida MLS.
How the Month Compared
SHENANDOAH
PRIOR
MONTH
CHANGE
SHENANDOAH
–
PRIOR
–
MONTH
–
CHANGE
–
THE LAST 12 MONTHS
The Last 12 Months in Shenandoah
Chart
Chart
ALL SALES, ROLLING 12 MONTHS
Rolling 12-month figures are calculated from closed MLS sales.
The charts illustrate monthly price fluctuations, while the rolling 12-month figures reflect all qualifying closed sales during the period, providing a broader perspective on Shenandoah’s market.
What 2023 Means for Buyers and Sellers in Shenandoah
SELLERS
For sellers, 2023 was a reminder that the market sets the price. Homes priced to current conditions still sold well, but listings priced on 2022’s peak needed reductions and more time.
BUYERS
For buyers, higher rates brought back something that had been missing: negotiating room. More time to decide, fewer bidding wars and real room to negotiate made 2023 a more balanced year to buy.
Text
YOUR SHENANDOAH HOME VALUE
Considering Selling a Home in Shenandoah?
Get a personalized valuation informed by current neighborhood sales and firsthand local experience.
Jorge Fernandez | The Shenandoah Guys | SERHANT.
About This Year in Review
This report analyzes single-family home sales and market activity in Shenandoah, Miami, for calendar year 2023, using Southeast Florida MLS data. Jorge Fernandez provides firsthand market analysis and local context to explain the why behind the data and what it means for Shenandoah homeowners, sellers and buyers.
REPORTING PERIOD
January 1 – December 31, 2023
MLS DATA CURRENT AS OF
—
PUBLISHED
—
DATA SOURCE
Southeast Florida MLS
Condominium and townhome sales are not included. Sales referenced may include properties in which Jorge Fernandez/The Shenandoah Guys at SERHANT. Florida LLC did not represent the buyer or seller. Information is provided for market analysis purposes.

REPORT PREPARED BY
Jorge Fernandez, REALTOR®
The Shenandoah Guys | SERHANT. Florida
Professional Recognition & Designations
2026 RealTrends Verified | Top 1.5% Nationwide
Certified Luxury Home Marketing Specialist (CLHMS™) | Million Dollar GUILD™
Master Brokers Forum | Advisory Board
Local Expertise
Miami Native | 21+ Years of Real Estate Experience | 10-Year Shenandoah Resident
Florida Real Estate License #SL3158278
Florida Real Estate License #SL3158278
The Shenandoah Guys | SERHANT. Florida
Miami Native | 21+ Years of Real Estate Experience | 10-Year Shenandoah Resident
← PREVIOUS REPORT
NEXT REPORT →