
YOUR NEIGHBORS IN REAL ESTATE


Hablamos Español


YEAR IN REVIEW
Shenandoah Miami Real Estate: 2022 Year in Review
By Jorge Fernandez, REALTOR®
Market data and analysis from Jorge Fernandez, Shenandoah resident and local real estate market expert, with The Shenandoah Guys at SERHANT.
A full-year look at Shenandoah single-family sales in 2022: prices, pace, negotiating power and how our neighborhood’s market changed compared with 2021.
2022 Shenandoah Real Estate at a Glance
Single-family homes · Southeast Florida MLS · Change vs. 2021
LABEL
—
—
LABEL
—
—
LABEL
—
—
LABEL
—
—
LABEL
—
—
Months of inventory
Calculation
MEDIAN SALE PRICE
$760,000
↑ 25.6% vs. 2021
MEDIAN SOLD $ / SQ. FT.
$460
↑ 27.4% vs. 2021
CLOSED SALES
107
↓ 44 vs. 2021
TOTAL SALES VOLUME
$89.6M
↓ 7.9% vs. 2021
SOLD VS. ORIGINAL LIST PRICE
97.2%
↓ 0.3 pts vs. 2021
MEDIAN DAYS ON MARKET
28
→ 0 vs. 2021
MARKET ACTIVITY
160
Homes Listed for Sale
↓ 22 vs. 2021
98.6%
Sold vs. Final List Price
↑ 0.3 pts vs. 2021
26%
Sold After Price Reduction
↑ 1 pt vs. 2021
—
Label
—
Label
Year to date
The 2022 Shenandoah Market in Review
Record prices and a sharp change in pace defined 2022 in Shenandoah, a year of two very different halves. 107 single-family homes closed, down from 151 in 2021, and total sales volume eased 7.9% to $89.6 million. But the homes that did sell commanded far more. The median sale price jumped 25.6% to $760,000, and the median price per square foot rose 27.4% to $460, the largest one-year gains in our neighborhood since at least 2016. That was more than double the gain across Miami-Dade County, where the single-family median rose 11.1% to $550,000.
The year began with mortgage rates near 3%, pandemic-era demand still running hot, and a steady stream of buyers relocating to Miami. Then inflation reached a 40-year high, and the Federal Reserve responded with seven rate increases starting in March, including four three-quarter-point hikes. Thirty-year mortgage rates more than doubled, passing 7% in late October for the first time in two decades. Hurricane Ian’s landfall on Florida’s Gulf Coast in September added to the turmoil in Florida’s homeowners insurance market. In a matter of months, the cost of buying the same home rose dramatically.
Spring felt like a frenzy; by fall, it had cooled. In the first half of the year, 66 homes closed, and in several months the typical home sold at or above its full original asking price. For the year, the median home sold in just 28 days, and 43% of sales closed at or above asking. From July through December, only 41 homes closed, and buyers began negotiating again as rates climbed. The prices set in the spring held, but the pace of sales did not.
Rising prices also reshaped the market. Sales under $750,000 fell from 113 to 50, while sales of $1 million and above more than tripled, from 7 to 24. That included the highest sale in our neighborhood since at least 2016: 1651 SW 13th Avenue, a 1947 home that sold in June for $2,750,000. Featured below is 1918 SW 17th Terrace, a home I represented that sold in January for $608,000.
Our neighborhood came together outside the market, too. In April, the Miami Shenandoah Neighborhood Association organized the Shenandoah Earth Day Neighborhood Clean-Up in and around Bryan Park, bringing neighbors together to care for one of our local green spaces.
Shenandoah Since 2016: The Long-Term Trend
2016 – 2022 · single-family homes · one point per year
Median Sale Price
Full-year median, 2016–2022
Median Price per Sq. Ft.
Full-year median, 2016–2022
Closed Sales per Year
Single-family homes
Sold vs. Original List Price
Median, as a percent of original asking price
FEATURED 2022 CLOSING
1918 SW 17th Terrace, Miami
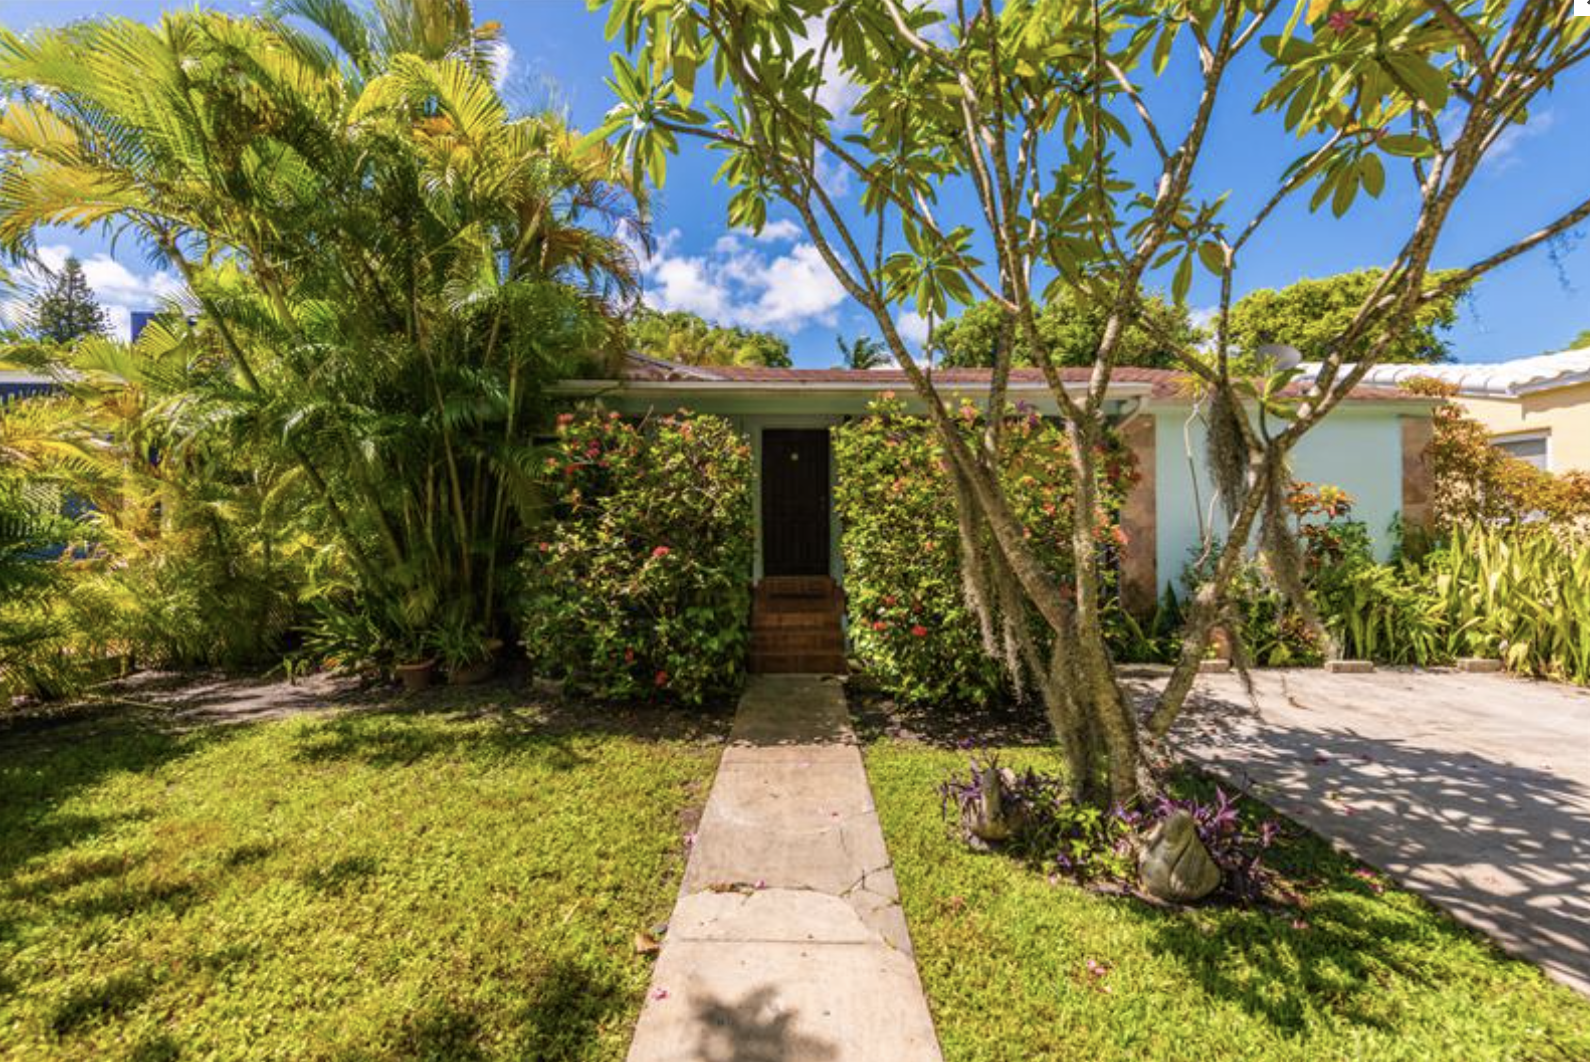
Sold | Listed by Jorge Fernandez
The Shenandoah Guys
Details
Bedrooms
3
Bathrooms
2
Living Area
1,726 sq. ft.
Lot Size
5,800 sq. ft.
Original List Price
$640,000
Sale Price
$608,000
Closing Date
January 11, 2022
Disclosure
Watch Property Video →
Write-up
FEATURED SHENANDOAH CLOSING
Featured closing

Sold by Jorge Fernandez
Details
Label
Value
Label
Value
Label
Value
Label
Value
Label
Value
Label
Value
Label
Value
Disclosure
Watch Property Video →
Write-up
FEATURED SHENANDOAH CLOSING
Featured closing
Sold by Jorge Fernandez
Details
Label
Value
Label
Value
Label
Value
Label
Value
Label
Value
Label
Value
Label
Value
Disclosure
Watch Property Video →
Write-up
Market Snapshot
Snapshot
How 2022 Compared With 2021
Shenandoah single-family homes
SHENANDOAH SINGLE-FAMILY
2021
2022
CHANGE
SHENANDOAH SINGLE-FAMILY
Closed sales
2021
151
2022
107
CHANGE
↓ 29%
SHENANDOAH SINGLE-FAMILY
Total sales volume
2021
$97.3M
2022
$89.6M
CHANGE
↓ 7.9%
SHENANDOAH SINGLE-FAMILY
Median sold price
2021
$605,000
2022
$760,000
CHANGE
↑ 25.6%
SHENANDOAH SINGLE-FAMILY
Median original asking price
2021
$630,000
2022
$799,500
CHANGE
↑ 26.9%
SHENANDOAH SINGLE-FAMILY
Median price / sq. ft.
2021
$361
2022
$460
CHANGE
↑ 27.4%
SHENANDOAH SINGLE-FAMILY
Sold vs. original list price
2021
97.5%
2022
97.2%
CHANGE
↓ 0.3 pts
SHENANDOAH SINGLE-FAMILY
Sold vs. final list price
2021
98.3%
2022
98.6%
CHANGE
↑ 0.3 pts
SHENANDOAH SINGLE-FAMILY
Median days on market
2021
28
2022
28
CHANGE
→ 0
SHENANDOAH SINGLE-FAMILY
Sales after a price reduction
2021
25%
2022
26%
CHANGE
↑ 1 pt
SHENANDOAH SINGLE-FAMILY
Sold at or above asking
2021
42%
2022
43%
CHANGE
↑ 1 pt
SHENANDOAH SINGLE-FAMILY
Homes listed for sale
2021
182
2022
160
CHANGE
↓ 12%
SHENANDOAH SINGLE-FAMILY
Months of supply (approx.)
2021
3.3
2022
5.1
CHANGE
↑ 1.8
SHENANDOAH SINGLE-FAMILY
Listings that sold (approx.)
2021
78%
2022
71%
CHANGE
↓ 7 pts
SHENANDOAH SINGLE-FAMILY
Median living area
2021
1,665 sq. ft.
2022
1,742 sq. ft.
CHANGE
↑ 5%
SHENANDOAH SINGLE-FAMILY
Median lot size
2021
5,948 sq. ft.
2022
5,900 sq. ft.
CHANGE
↓ 1%
Approximate figures are estimated from listings that expired or were cancelled without selling; homes relisted and sold within a year are counted as sold.
2022 Month by Month
Swipe sideways to see all columns →
MONTH
CLOSED SALES
MEDIAN SOLD PRICE
MEDIAN $ / SQ. FT.
MEDIAN DAYS ON MARKET
SOLD VS. ORIGINAL LIST
MONTH
January
CLOSED SALES
16
MEDIAN SOLD PRICE
$700,000
MEDIAN $ / SQ. FT.
$388
MEDIAN DAYS ON MARKET
35
SOLD VS. ORIGINAL LIST
96.5%
MONTH
February
CLOSED SALES
10
MEDIAN SOLD PRICE
$716,750
MEDIAN $ / SQ. FT.
$427
MEDIAN DAYS ON MARKET
52
SOLD VS. ORIGINAL LIST
96.1%
MONTH
March
CLOSED SALES
8
MEDIAN SOLD PRICE
$787,500
MEDIAN $ / SQ. FT.
$404
MEDIAN DAYS ON MARKET
11
SOLD VS. ORIGINAL LIST
100.0%
MONTH
April
CLOSED SALES
13
MEDIAN SOLD PRICE
$690,000
MEDIAN $ / SQ. FT.
$447
MEDIAN DAYS ON MARKET
24
SOLD VS. ORIGINAL LIST
100.0%
MONTH
May
CLOSED SALES
7
MEDIAN SOLD PRICE
$855,000
MEDIAN $ / SQ. FT.
$507
MEDIAN DAYS ON MARKET
10
SOLD VS. ORIGINAL LIST
97.3%
MONTH
June
CLOSED SALES
12
MEDIAN SOLD PRICE
$990,000
MEDIAN $ / SQ. FT.
$550
MEDIAN DAYS ON MARKET
15
SOLD VS. ORIGINAL LIST
100.1%
MONTH
July
CLOSED SALES
3
MEDIAN SOLD PRICE
$560,000
MEDIAN $ / SQ. FT.
$462
MEDIAN DAYS ON MARKET
41
SOLD VS. ORIGINAL LIST
81.8%
MONTH
August
CLOSED SALES
13
MEDIAN SOLD PRICE
$760,000
MEDIAN $ / SQ. FT.
$556
MEDIAN DAYS ON MARKET
25
SOLD VS. ORIGINAL LIST
94.6%
MONTH
September
CLOSED SALES
6
MEDIAN SOLD PRICE
$795,000
MEDIAN $ / SQ. FT.
$417
MEDIAN DAYS ON MARKET
50
SOLD VS. ORIGINAL LIST
89.6%
MONTH
October
CLOSED SALES
9
MEDIAN SOLD PRICE
$725,000
MEDIAN $ / SQ. FT.
$548
MEDIAN DAYS ON MARKET
36
SOLD VS. ORIGINAL LIST
96.6%
MONTH
November
CLOSED SALES
4
MEDIAN SOLD PRICE
$975,000
MEDIAN $ / SQ. FT.
$500
MEDIAN DAYS ON MARKET
64
SOLD VS. ORIGINAL LIST
96.0%
MONTH
December
CLOSED SALES
6
MEDIAN SOLD PRICE
$712,500
MEDIAN $ / SQ. FT.
$436
MEDIAN DAYS ON MARKET
22
SOLD VS. ORIGINAL LIST
92.5%
Closed Sales by Month
2022 · single-family homes
Where Homes Sold: Price Ranges
Closed single-family sales by price range, 2021 vs. 2022
Existing Homes vs. New Construction
Swipe sideways to see all columns →
HOME TYPE
SALES
MEDIAN PRICE
$ / SQ. FT.
MEDIAN DOM
HOME TYPE
Built before 1960
SALES
94
MEDIAN PRICE
$749,500
$ / SQ. FT.
$462
MEDIAN DOM
24
HOME TYPE
Built 1960–2018
SALES
11
MEDIAN PRICE
$815,000
$ / SQ. FT.
$458
MEDIAN DOM
31
HOME TYPE
New construction (2019–2022)
SALES
2
MEDIAN PRICE
$1,122,500
$ / SQ. FT.
$533
MEDIAN DOM
230
Shenandoah Closed Sales, 2022
107 single-family sales · highest price first
Swipe sideways to see all columns →
ADDRESS
CLOSED PRICE ▼
$ / LIVING SQ. FT.
BEDS / BATHS
LIVING SQ. FT.
LOT SQ. FT.
DAYS ON MARKET
SOLD VS. ORIGINAL LIST
CLOSING DATE
ADDRESS
1651 SW 13th Ave.
CLOSED PRICE
$2,750,000
$ / LIVING SQ. FT.
$704
BEDS / BATHS
6 / 6
LIVING SQ. FT.
3,908
LOT SQ. FT.
11,500
DAYS ON MARKET
130
SOLD VS. ORIGINAL LIST
110.0%
CLOSING DATE
Jun 6
ADDRESS
2000 SW 17th Ter.
CLOSED PRICE
$1,575,000
$ / LIVING SQ. FT.
$657
BEDS / BATHS
4 / 3.5
LIVING SQ. FT.
2,397
LOT SQ. FT.
8,089
DAYS ON MARKET
94
SOLD VS. ORIGINAL LIST
92.6%
CLOSING DATE
Jun 8
ADDRESS
1724 SW 22nd Ave.
CLOSED PRICE
$1,575,000
$ / LIVING SQ. FT.
$542
BEDS / BATHS
4 / 3
LIVING SQ. FT.
2,904
LOT SQ. FT.
10,492
DAYS ON MARKET
13
SOLD VS. ORIGINAL LIST
98.7%
CLOSING DATE
Jun 1
ADDRESS
1860 SW 12th St.
CLOSED PRICE
$1,533,000
$ / LIVING SQ. FT.
$537
BEDS / BATHS
4 / 3.5
LIVING SQ. FT.
2,855
LOT SQ. FT.
8,850
DAYS ON MARKET
85
SOLD VS. ORIGINAL LIST
100.0%
CLOSING DATE
Nov 9
ADDRESS
1425 SW 11th Ter.
CLOSED PRICE
$1,455,000
$ / LIVING SQ. FT.
$601
BEDS / BATHS
3 / 3
LIVING SQ. FT.
2,421
LOT SQ. FT.
5,900
DAYS ON MARKET
5
SOLD VS. ORIGINAL LIST
107.8%
CLOSING DATE
Feb 24
ADDRESS
1520 SW 12th Ave.
CLOSED PRICE
$1,450,000
$ / LIVING SQ. FT.
$671
BEDS / BATHS
3 / 3.5
LIVING SQ. FT.
2,160
LOT SQ. FT.
6,350
DAYS ON MARKET
116
SOLD VS. ORIGINAL LIST
85.3%
CLOSING DATE
Oct 12
ADDRESS
1743 SW 11th St.
CLOSED PRICE
$1,425,000
$ / LIVING SQ. FT.
$598
BEDS / BATHS
5 / 3.5
LIVING SQ. FT.
2,381
LOT SQ. FT.
5,900
DAYS ON MARKET
7
SOLD VS. ORIGINAL LIST
97.3%
CLOSING DATE
May 9
ADDRESS
2130 SW 9th St.
CLOSED PRICE
$1,400,000
$ / LIVING SQ. FT.
$556
BEDS / BATHS
4 / 3.5
LIVING SQ. FT.
2,519
LOT SQ. FT.
DAYS ON MARKET
37
SOLD VS. ORIGINAL LIST
100.0%
CLOSING DATE
Aug 8
ADDRESS
1944 SW 16th Ter.
CLOSED PRICE
$1,362,000
$ / LIVING SQ. FT.
$583
BEDS / BATHS
5 / 4
LIVING SQ. FT.
2,335
LOT SQ. FT.
12,041
DAYS ON MARKET
7
SOLD VS. ORIGINAL LIST
97.3%
CLOSING DATE
Mar 17
ADDRESS
2321 SW 19th St.
CLOSED PRICE
$1,320,000
$ / LIVING SQ. FT.
$627
BEDS / BATHS
3 / 2
LIVING SQ. FT.
2,106
LOT SQ. FT.
6,650
DAYS ON MARKET
29
SOLD VS. ORIGINAL LIST
94.6%
CLOSING DATE
Aug 5
ADDRESS
1920 SW 16th St.
CLOSED PRICE
$1,220,000
$ / LIVING SQ. FT.
$371
BEDS / BATHS
5 / 3
LIVING SQ. FT.
3,285
LOT SQ. FT.
5,100
DAYS ON MARKET
82
SOLD VS. ORIGINAL LIST
81.6%
CLOSING DATE
Jan 7
ADDRESS
1852 SW 10th St.
CLOSED PRICE
$1,133,500
$ / LIVING SQ. FT.
$507
BEDS / BATHS
4 / 3
LIVING SQ. FT.
2,235
LOT SQ. FT.
5,900
DAYS ON MARKET
10
SOLD VS. ORIGINAL LIST
100.8%
CLOSING DATE
May 6
ADDRESS
1650 SW 18th St.
CLOSED PRICE
$1,100,000
$ / LIVING SQ. FT.
$504
BEDS / BATHS
4 / 3
LIVING SQ. FT.
2,181
LOT SQ. FT.
6,750
DAYS ON MARKET
29
SOLD VS. ORIGINAL LIST
88.0%
CLOSING DATE
Aug 18
ADDRESS
1745 SW 10th St.
CLOSED PRICE
$1,100,000
$ / LIVING SQ. FT.
$405
BEDS / BATHS
5 / 3.5
LIVING SQ. FT.
2,713
LOT SQ. FT.
5,900
DAYS ON MARKET
56
SOLD VS. ORIGINAL LIST
81.5%
CLOSING DATE
Sept 27
ADDRESS
1737 SW 10th St.
CLOSED PRICE
$1,080,000
$ / LIVING SQ. FT.
$645
BEDS / BATHS
3 / 2
LIVING SQ. FT.
1,674
LOT SQ. FT.
5,900
DAYS ON MARKET
40
SOLD VS. ORIGINAL LIST
90.0%
CLOSING DATE
Jun 21
ADDRESS
1420 SW 12th St.
CLOSED PRICE
$1,075,000
$ / LIVING SQ. FT.
$558
BEDS / BATHS
3 / 2
LIVING SQ. FT.
1,927
LOT SQ. FT.
6,150
DAYS ON MARKET
30
SOLD VS. ORIGINAL LIST
90.0%
CLOSING DATE
May 11
ADDRESS
1935 SW 17th Ter.
CLOSED PRICE
$1,065,000
$ / LIVING SQ. FT.
$678
BEDS / BATHS
4 / 2
LIVING SQ. FT.
1,570
LOT SQ. FT.
5,800
DAYS ON MARKET
16
SOLD VS. ORIGINAL LIST
89.6%
CLOSING DATE
Oct 7
ADDRESS
2101 SW 22nd Ave.
CLOSED PRICE
$1,060,000
$ / LIVING SQ. FT.
$443
BEDS / BATHS
5 / 4
LIVING SQ. FT.
2,395
LOT SQ. FT.
7,593
DAYS ON MARKET
66
SOLD VS. ORIGINAL LIST
101.0%
CLOSING DATE
Jan 10
ADDRESS
1342 SW 17th St.
CLOSED PRICE
$1,050,000
$ / LIVING SQ. FT.
$513
BEDS / BATHS
4 / 4
LIVING SQ. FT.
2,046
LOT SQ. FT.
7,500
DAYS ON MARKET
28
SOLD VS. ORIGINAL LIST
89.4%
CLOSING DATE
Dec 22
ADDRESS
1637 SW 14th Ter.
CLOSED PRICE
$1,050,000
$ / LIVING SQ. FT.
$781
BEDS / BATHS
3 / 2
LIVING SQ. FT.
1,344
LOT SQ. FT.
8,175
DAYS ON MARKET
16
SOLD VS. ORIGINAL LIST
95.5%
CLOSING DATE
Dec 15
ADDRESS
2341 SW 16th Ter.
CLOSED PRICE
$1,000,000
$ / LIVING SQ. FT.
$371
BEDS / BATHS
5 / 4
LIVING SQ. FT.
2,694
LOT SQ. FT.
5,450
DAYS ON MARKET
3
SOLD VS. ORIGINAL LIST
105.4%
CLOSING DATE
Jun 17
ADDRESS
2260 SW 16th Ter.
CLOSED PRICE
$1,000,000
$ / LIVING SQ. FT.
$558
BEDS / BATHS
4 / 3
LIVING SQ. FT.
1,792
LOT SQ. FT.
5,450
DAYS ON MARKET
18
SOLD VS. ORIGINAL LIST
101.0%
CLOSING DATE
Jun 1
ADDRESS
1243 SW 21st St.
CLOSED PRICE
$1,000,000
$ / LIVING SQ. FT.
$595
BEDS / BATHS
4 / 3
LIVING SQ. FT.
1,682
LOT SQ. FT.
5,928
DAYS ON MARKET
15
SOLD VS. ORIGINAL LIST
100.5%
CLOSING DATE
Jan 20
ADDRESS
1325 SW 13th Ave.
CLOSED PRICE
$1,000,000
$ / LIVING SQ. FT.
$464
BEDS / BATHS
3 / 3
LIVING SQ. FT.
2,155
LOT SQ. FT.
7,500
DAYS ON MARKET
130
SOLD VS. ORIGINAL LIST
64.5%
CLOSING DATE
Nov 7
ADDRESS
1860 SW 11th St.
CLOSED PRICE
$980,000
$ / LIVING SQ. FT.
$542
BEDS / BATHS
4 / 2
LIVING SQ. FT.
1,807
LOT SQ. FT.
5,900
DAYS ON MARKET
17
SOLD VS. ORIGINAL LIST
98.1%
CLOSING DATE
Jun 10
ADDRESS
All 107 sales · median
CLOSED PRICE
$760,000
$ / LIVING SQ. FT.
$460
BEDS / BATHS
LIVING SQ. FT.
1,742
LOT SQ. FT.
5,900
DAYS ON MARKET
28
SOLD VS. ORIGINAL LIST
97.2%
CLOSING DATE
Source: Southeast Florida MLS.
How the Month Compared
SHENANDOAH
PRIOR
MONTH
CHANGE
SHENANDOAH
–
PRIOR
–
MONTH
–
CHANGE
–
THE LAST 12 MONTHS
The Last 12 Months in Shenandoah
Chart
Chart
ALL SALES, ROLLING 12 MONTHS
Rolling 12-month figures are calculated from closed MLS sales.
The charts illustrate monthly price fluctuations, while the rolling 12-month figures reflect all qualifying closed sales during the period, providing a broader perspective on Shenandoah’s market.
What 2022 Means for Buyers and Sellers in Shenandoah
SELLERS
For sellers, the first half of 2022 delivered record prices with little effort. As rates climbed in the fall, pricing and presentation mattered again, and sellers who adjusted early sold more smoothly.
BUYERS
For buyers, 2022 was a year of moving targets. Prices rose sharply in the spring, then rates rose sharply in the fall. Buyers who were prepared with financing and ready to act were the ones who secured homes in our neighborhood.
Text
YOUR SHENANDOAH HOME VALUE
Considering Selling a Home in Shenandoah?
Get a personalized valuation informed by current neighborhood sales and firsthand local experience.
Jorge Fernandez | The Shenandoah Guys | SERHANT.
About This Year in Review
This report analyzes single-family home sales and market activity in Shenandoah, Miami, for calendar year 2022, using Southeast Florida MLS data. Jorge Fernandez provides firsthand market analysis and local context to explain the why behind the data and what it means for Shenandoah homeowners, sellers and buyers.
REPORTING PERIOD
January 1 – December 31, 2022
MLS DATA CURRENT AS OF
—
PUBLISHED
—
DATA SOURCE
Southeast Florida MLS
Condominium and townhome sales are not included. Sales referenced may include properties in which Jorge Fernandez/The Shenandoah Guys at SERHANT. Florida LLC did not represent the buyer or seller. Information is provided for market analysis purposes.

REPORT PREPARED BY
Jorge Fernandez, REALTOR®
The Shenandoah Guys | SERHANT. Florida
Professional Recognition & Designations
2026 RealTrends Verified | Top 1.5% Nationwide
Certified Luxury Home Marketing Specialist (CLHMS™) | Million Dollar GUILD™
Master Brokers Forum | Advisory Board
Local Expertise
Miami Native | 21+ Years of Real Estate Experience | 10-Year Shenandoah Resident
Florida Real Estate License #SL3158278
Florida Real Estate License #SL3158278
The Shenandoah Guys | SERHANT. Florida
Miami Native | 21+ Years of Real Estate Experience | 10-Year Shenandoah Resident
← PREVIOUS REPORT
NEXT REPORT →