
YOUR NEIGHBORS IN REAL ESTATE


Hablamos Español


YEAR IN REVIEW
Shenandoah Miami Real Estate: 2021 Year in Review
By Jorge Fernandez, REALTOR®
Market data and analysis from Jorge Fernandez, Shenandoah resident and local real estate market expert, with The Shenandoah Guys at SERHANT.
A full-year look at Shenandoah single-family sales in 2021: prices, pace, negotiating power and how our neighborhood’s market changed compared with 2020.
2021 Shenandoah Real Estate at a Glance
Single-family homes · Southeast Florida MLS · Change vs. 2020
LABEL
—
—
LABEL
—
—
LABEL
—
—
LABEL
—
—
LABEL
—
—
Months of inventory
Calculation
MEDIAN SALE PRICE
$605,000
↑ 23.7% vs. 2020
MEDIAN SOLD $ / SQ. FT.
$361
↑ 12.1% vs. 2020
CLOSED SALES
151
↑ 32 vs. 2020
TOTAL SALES VOLUME
$97.3M
↑ 58.2% vs. 2020
SOLD VS. ORIGINAL LIST PRICE
97.5%
↑ 2.4 pts vs. 2020
MEDIAN DAYS ON MARKET
28
↓ 14 days vs. 2020
MARKET ACTIVITY
182
Homes Listed for Sale
↑ 14 vs. 2020
98.3%
Sold vs. Final List Price
↑ 0.9 pts vs. 2020
25%
Sold After Price Reduction
↓ 14 pts vs. 2020
—
Label
—
Label
Year to date
The 2021 Shenandoah Market in Review
151 homes sold in Shenandoah in 2021, more than in any year since at least 2016, and nearly every measure of demand hit a high. Total sales volume jumped 58% to $97.3 million. The median sale price rose 23.7% to $605,000, the first time it topped $600,000, and the median price per square foot rose 12.1% to $361. Prices climbed at about the same pace as across Miami-Dade County, where the single-family median rose 23.1% to $495,000.
The fuel was historically cheap money and a wave of new arrivals. Thirty-year mortgage rates opened the year at a record low of 2.65% and stayed near 3% for most of it, while the Federal Reserve held its benchmark rate near zero. Remote work and the pandemic brought buyers from New York, California and the Northeast to South Florida, and Miami’s growing reputation as a home for finance and tech companies added to the momentum. Many of these newcomers who wanted to be close to Brickell and Downtown, but didn’t necessarily want condo living, started exploring the residential neighborhoods nearby, such as Coconut Grove, The Roads and Shenandoah. The Surfside condominium collapse in June only reinforced that preference for single-family homes.
Buyers had to move fast. The median home sold in just 28 days, down from 42 in 2020, and 42% of sales closed at or above asking, up from 24%. Only a quarter of sales needed a price reduction, and the typical home sold at 97.5% of its original list price. Even with 182 homes listed for sale, the most of any year in our data, inventory was absorbed quickly: roughly three months of supply, the tightest market since at least 2016.
2021 was also the year Shenandoah crossed the million-dollar threshold. Seven homes sold for $1 million or more, after none in the five years before. The highest sales were 1441 SW 11th Terrace, a 1924 home that sold in September for $1,300,100, and 1804 SW 16th Avenue at $1,300,000. Featured below are two homes I represented in 2021: 1890 SW 11th Street, which sold in February for $595,000, and 1130 SW 23rd Avenue, one of those seven million-dollar sales, which closed in December for $1,050,000.
It was a milestone year for the neighborhood itself, too. In January, the Miami Shenandoah Neighborhood Association organized a neighborhood trash walk, bringing together neighbors and elected officials to make our streets cleaner while following COVID safety protocols. In April, after five years in the making, the Beautification Committee of the Miami Shenandoah Neighborhood Association placed 10 neighborhood markers at key locations throughout Shenandoah. And in October, I attended the groundbreaking ceremony for the new pool and park improvements at Shenandoah Park, a major investment in our neighborhood.
Shenandoah Since 2016: The Long-Term Trend
2016 – 2021 · single-family homes · one point per year
Median Sale Price
Full-year median, 2016–2021
Median Price per Sq. Ft.
Full-year median, 2016–2021
Closed Sales per Year
Single-family homes
Sold vs. Original List Price
Median, as a percent of original asking price
FEATURED 2021 CLOSINGS
1890 SW 11th Street, Miami
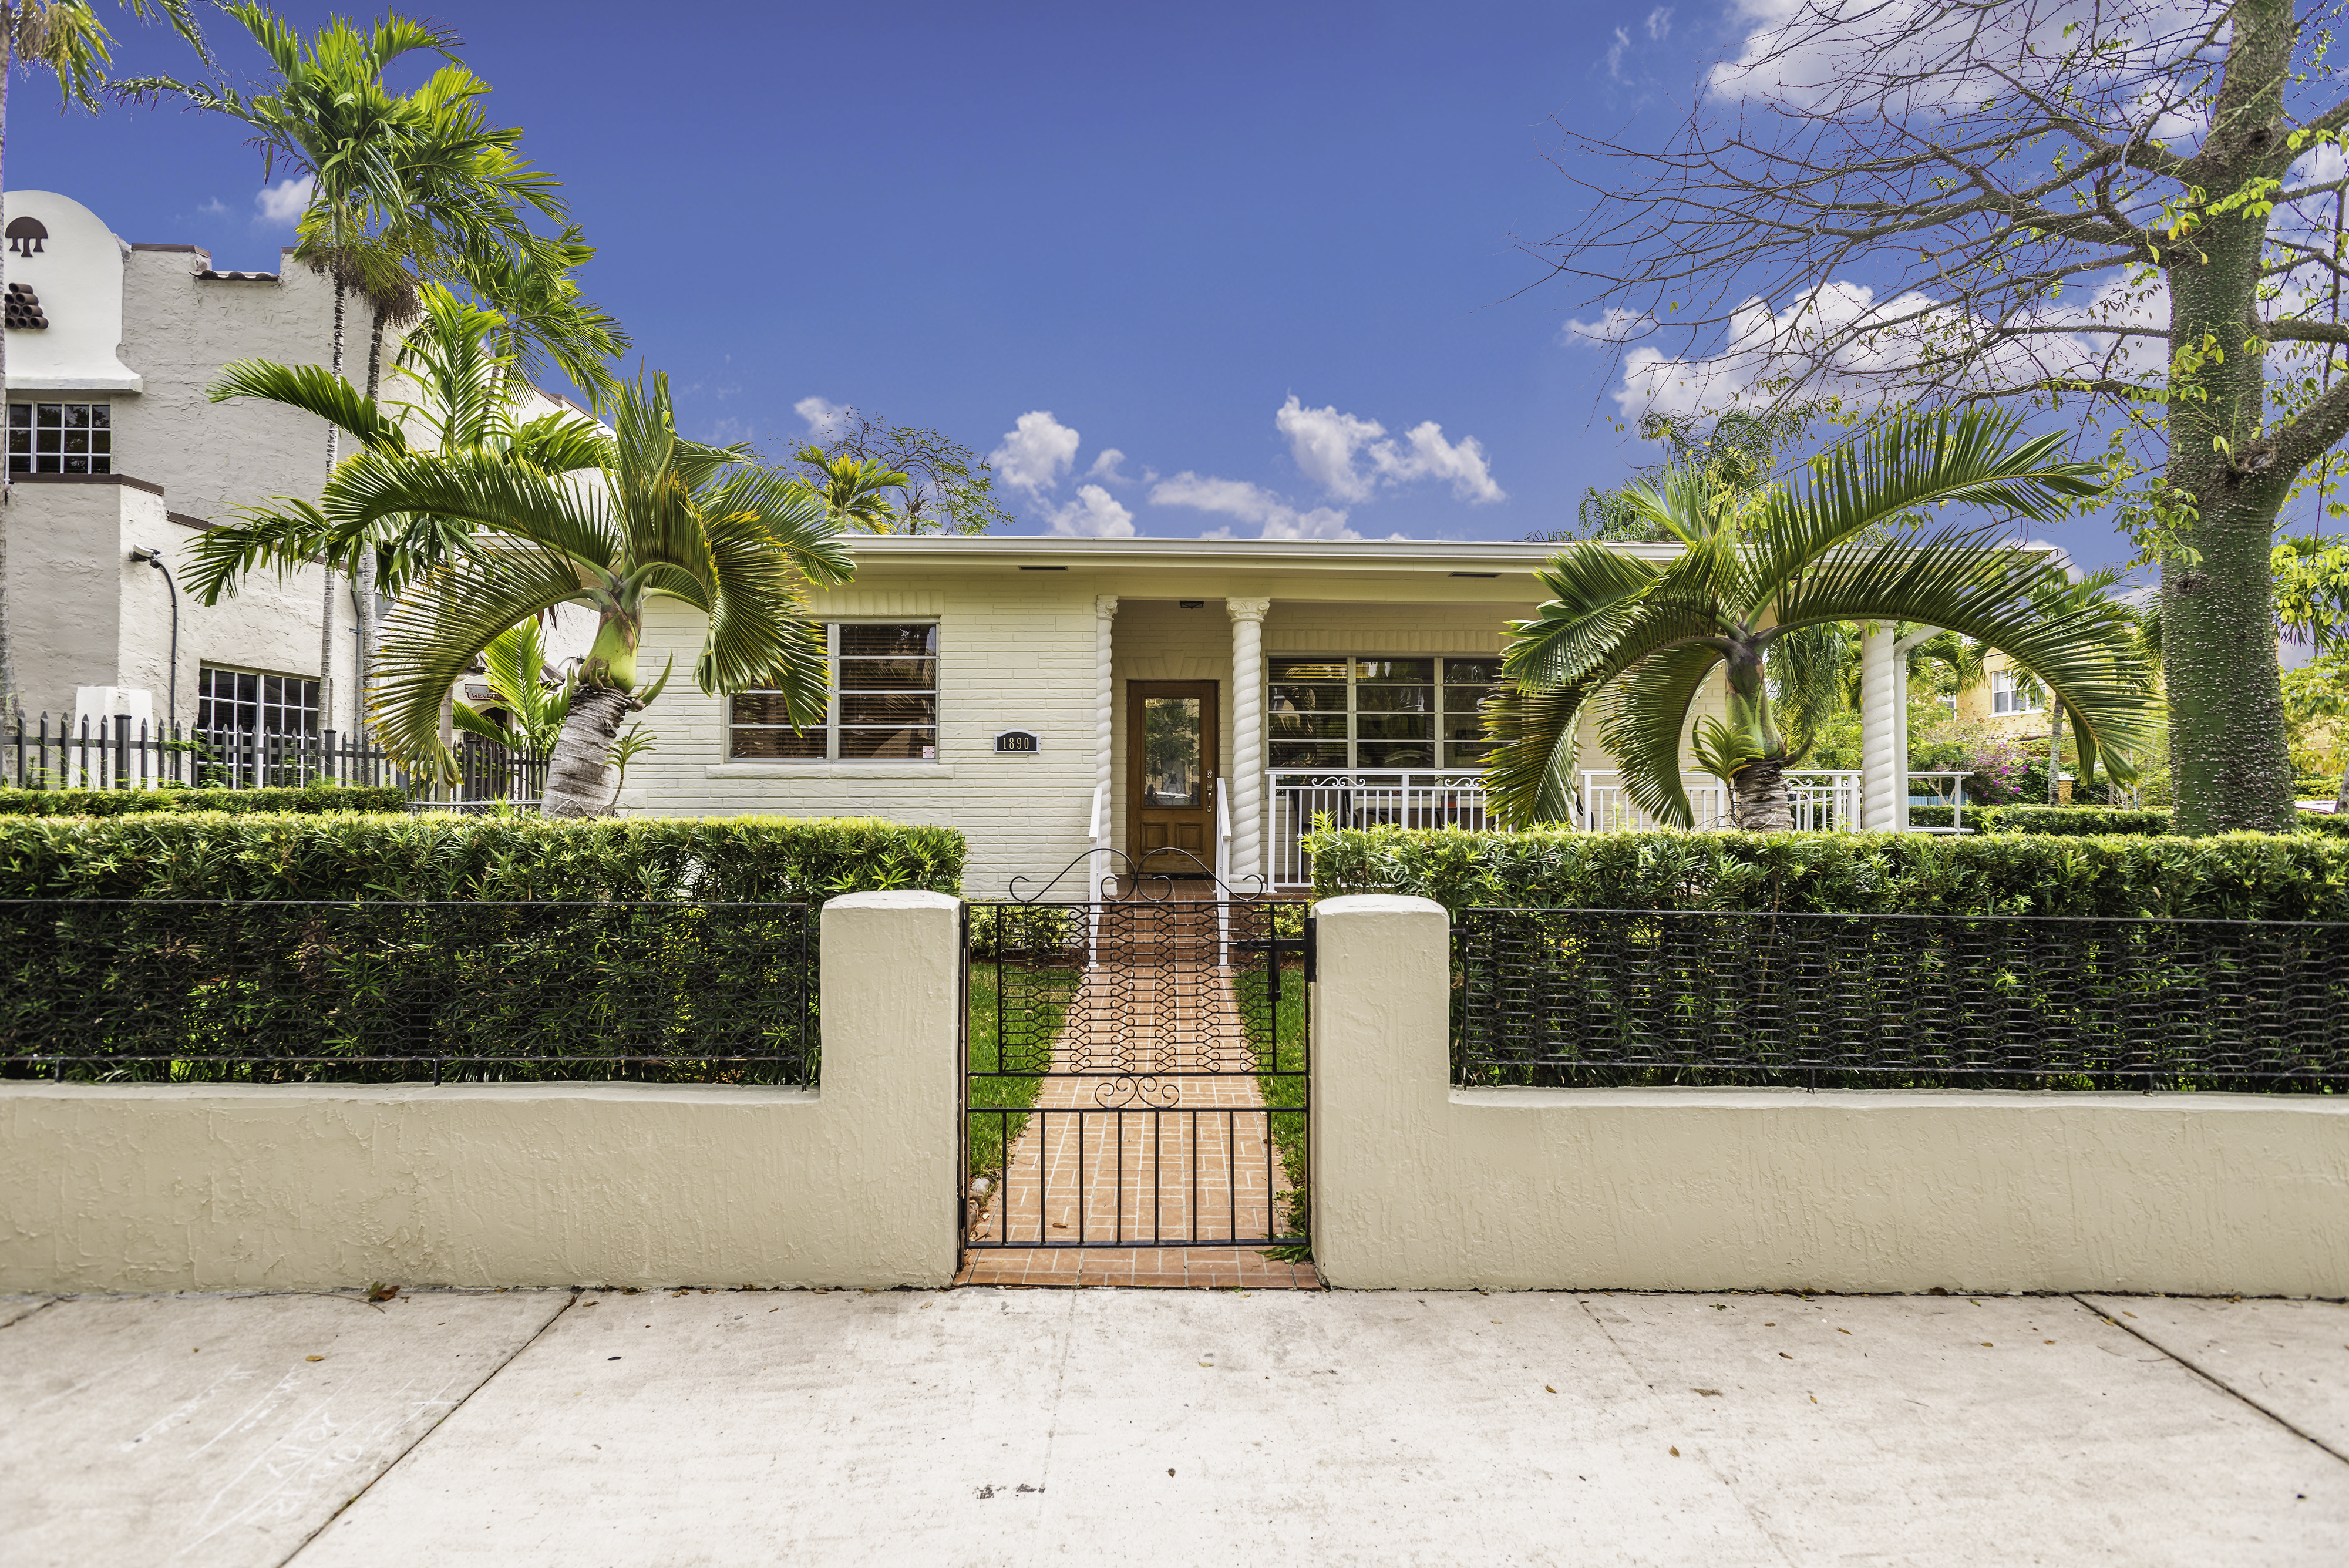
Sold | Listed by Jorge Fernandez
The Shenandoah Guys
Details
Bedrooms
4
Bathrooms
3
Living Area
2,479 sq. ft.
Lot Size
6,748 sq. ft.
Original List Price
$625,000
Sale Price
$595,000
Closing Date
February 9, 2021
Disclosure
Watch Property Video →
Write-up
FEATURED SHENANDOAH CLOSING
1130 SW 23rd Avenue, Miami
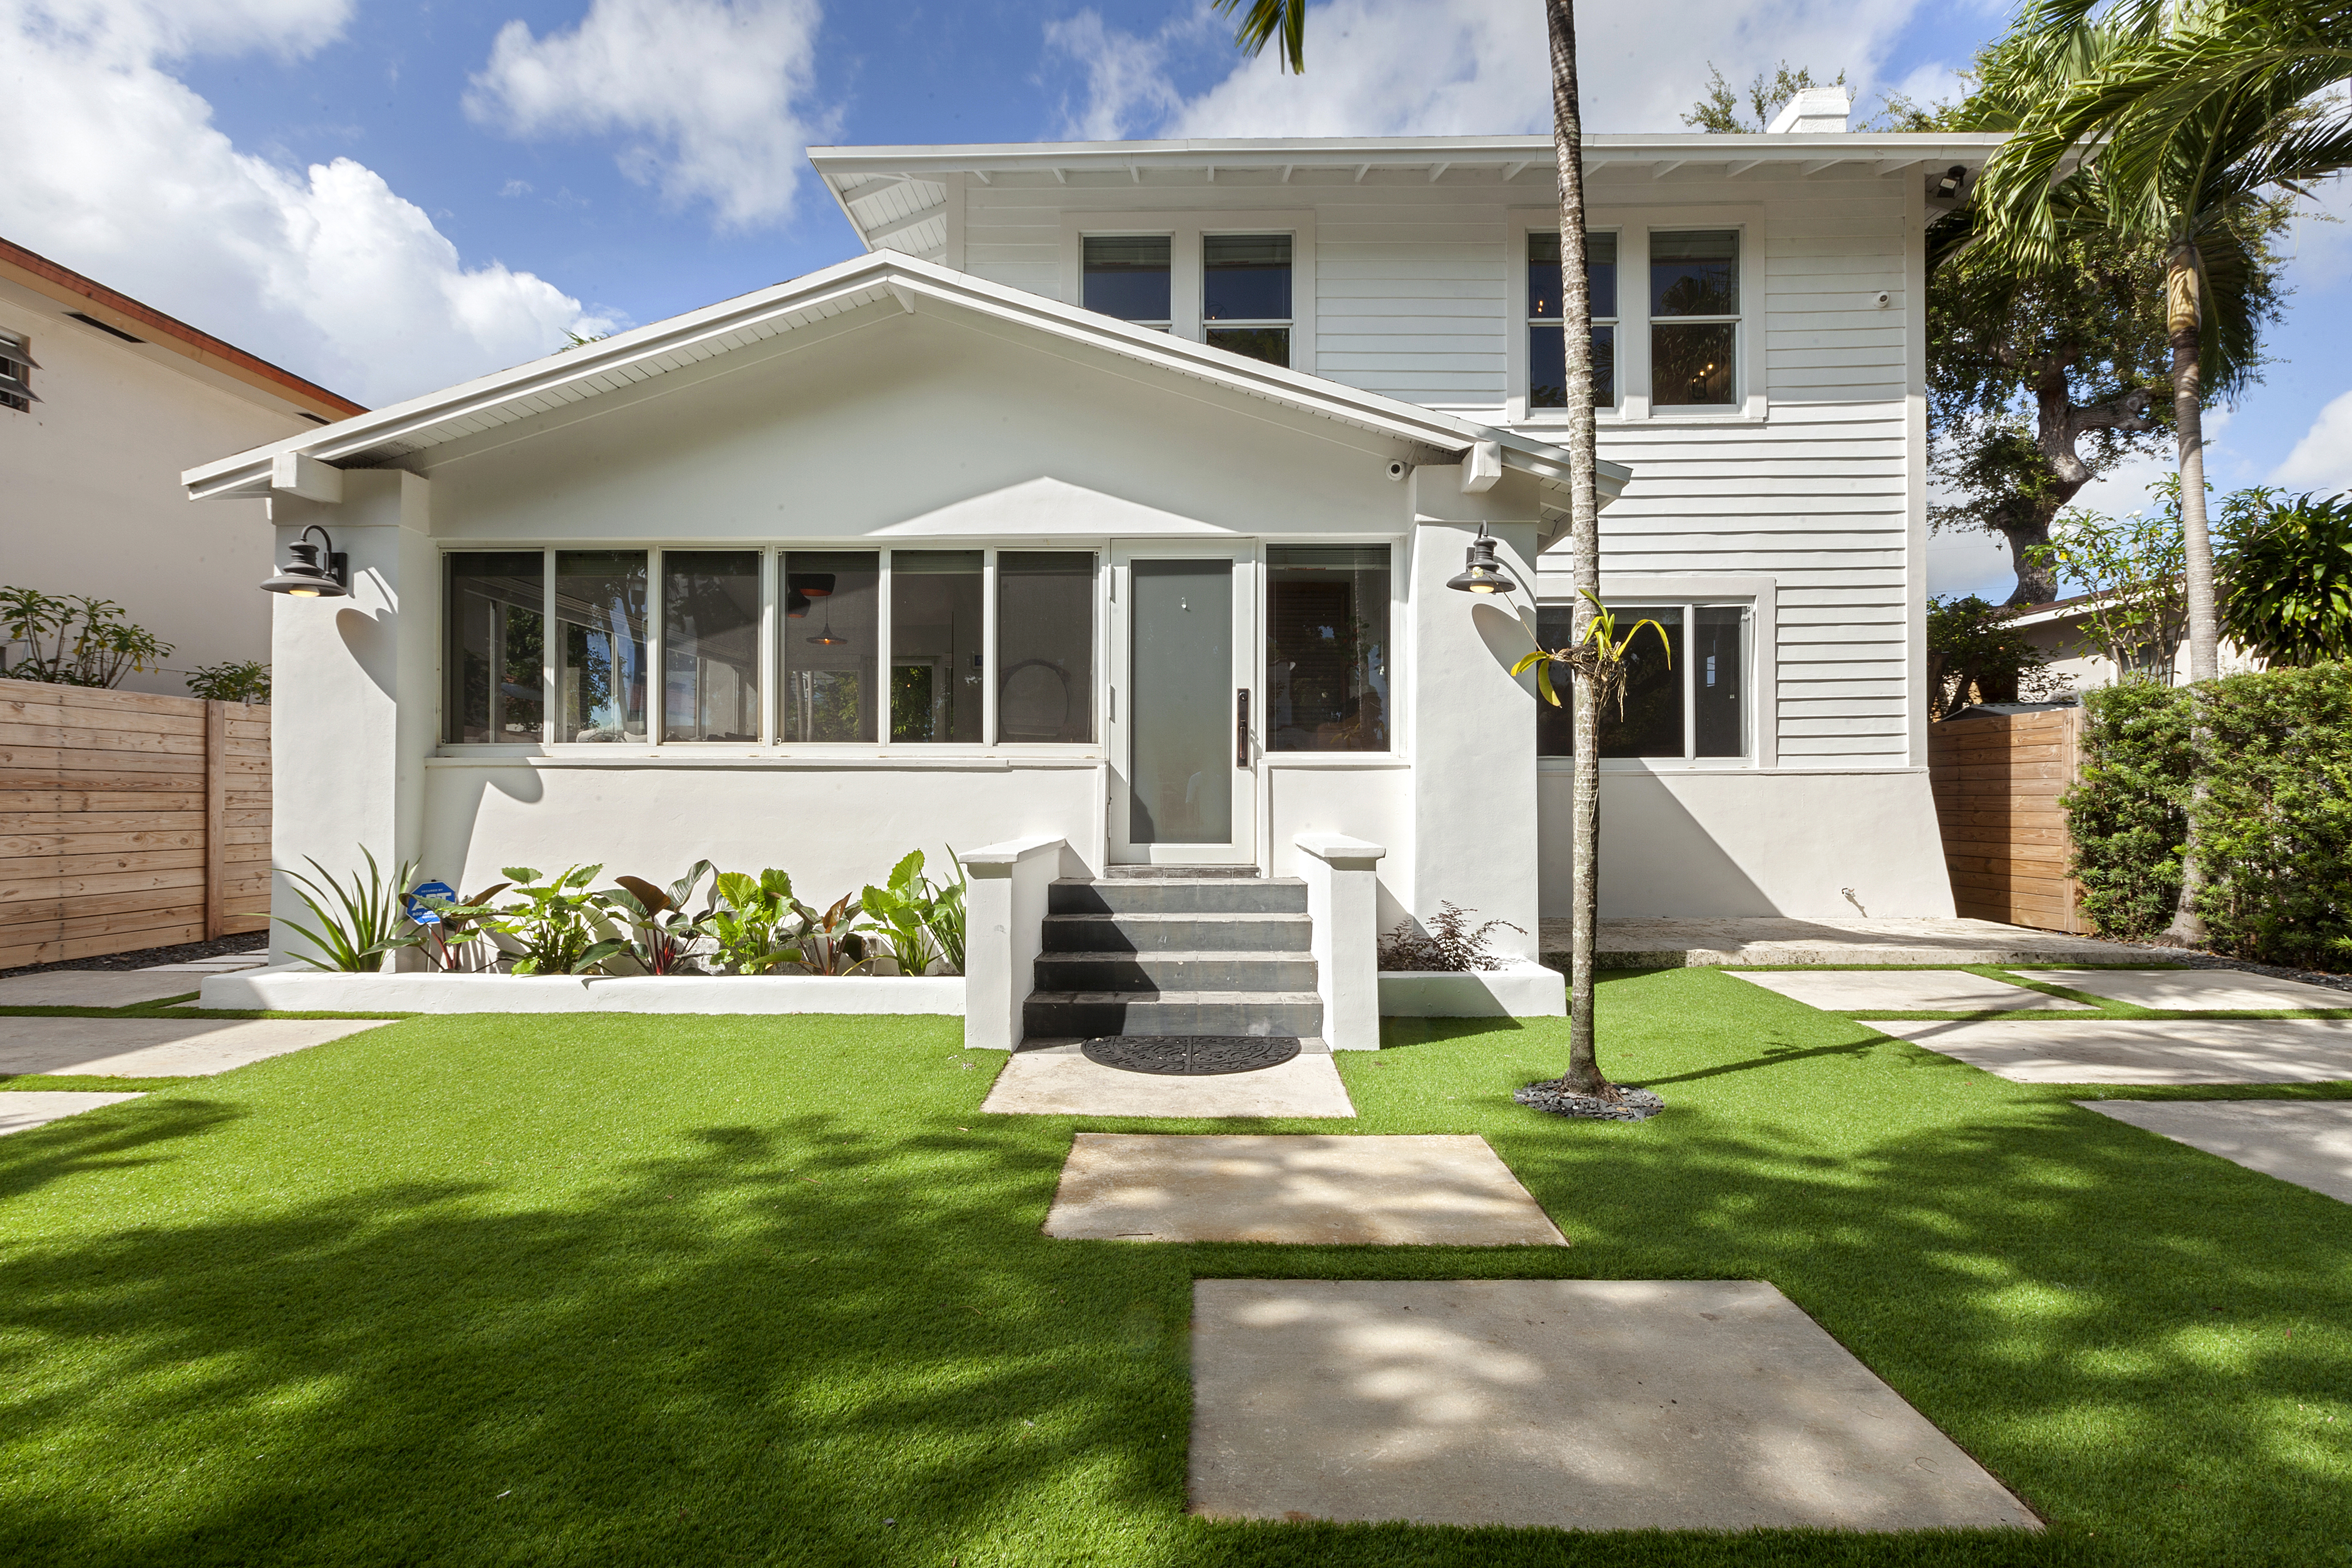
Sold | Listed by Jorge Fernandez
The Shenandoah Guys
Details
Bedrooms
4
Bathrooms
4.5
Living Area
1,701 sq. ft.
Lot Size
6,000 sq. ft.
Original List Price
$1,100,000
Sale Price
$1,050,000
Closing Date
December 17, 2021
Disclosure
Write-up
FEATURED SHENANDOAH CLOSING
Featured closing

Sold by Jorge Fernandez
Details
Label
Value
Label
Value
Label
Value
Label
Value
Label
Value
Label
Value
Label
Value
Disclosure
Watch Property Video →
Write-up
Market Snapshot
Snapshot
How 2021 Compared With 2020
Shenandoah single-family homes
SHENANDOAH SINGLE-FAMILY
2020
2021
CHANGE
SHENANDOAH SINGLE-FAMILY
Closed sales
2020
119
2021
151
CHANGE
↑ 27%
SHENANDOAH SINGLE-FAMILY
Total sales volume
2020
$61.5M
2021
$97.3M
CHANGE
↑ 58.2%
SHENANDOAH SINGLE-FAMILY
Median sold price
2020
$489,000
2021
$605,000
CHANGE
↑ 23.7%
SHENANDOAH SINGLE-FAMILY
Median original asking price
2020
$535,000
2021
$630,000
CHANGE
↑ 17.8%
SHENANDOAH SINGLE-FAMILY
Median price / sq. ft.
2020
$322
2021
$361
CHANGE
↑ 12.1%
SHENANDOAH SINGLE-FAMILY
Sold vs. original list price
2020
95.1%
2021
97.5%
CHANGE
↑ 2.4 pts
SHENANDOAH SINGLE-FAMILY
Sold vs. final list price
2020
97.4%
2021
98.3%
CHANGE
↑ 0.9 pts
SHENANDOAH SINGLE-FAMILY
Median days on market
2020
42
2021
28
CHANGE
↓ 14 days
SHENANDOAH SINGLE-FAMILY
Sales after a price reduction
2020
39%
2021
25%
CHANGE
↓ 14 pts
SHENANDOAH SINGLE-FAMILY
Sold at or above asking
2020
24%
2021
42%
CHANGE
↑ 18 pts
SHENANDOAH SINGLE-FAMILY
Homes listed for sale
2020
168
2021
182
CHANGE
↑ 8%
SHENANDOAH SINGLE-FAMILY
Months of supply (approx.)
2020
5.9
2021
3.3
CHANGE
↓ 2.6
SHENANDOAH SINGLE-FAMILY
Listings that sold (approx.)
2020
67%
2021
78%
CHANGE
↑ 11 pts
SHENANDOAH SINGLE-FAMILY
Median living area
2020
1,589 sq. ft.
2021
1,665 sq. ft.
CHANGE
↑ 5%
SHENANDOAH SINGLE-FAMILY
Median lot size
2020
5,928 sq. ft.
2021
5,948 sq. ft.
CHANGE
→ 0
Approximate figures are estimated from listings that expired or were cancelled without selling; homes relisted and sold within a year are counted as sold.
2021 Month by Month
Swipe sideways to see all columns →
MONTH
CLOSED SALES
MEDIAN SOLD PRICE
MEDIAN $ / SQ. FT.
MEDIAN DAYS ON MARKET
SOLD VS. ORIGINAL LIST
MONTH
January
CLOSED SALES
9
MEDIAN SOLD PRICE
$579,000
MEDIAN $ / SQ. FT.
$321
MEDIAN DAYS ON MARKET
80
SOLD VS. ORIGINAL LIST
93.5%
MONTH
February
CLOSED SALES
14
MEDIAN SOLD PRICE
$482,500
MEDIAN $ / SQ. FT.
$288
MEDIAN DAYS ON MARKET
25
SOLD VS. ORIGINAL LIST
98.2%
MONTH
March
CLOSED SALES
19
MEDIAN SOLD PRICE
$575,000
MEDIAN $ / SQ. FT.
$356
MEDIAN DAYS ON MARKET
66
SOLD VS. ORIGINAL LIST
97.6%
MONTH
April
CLOSED SALES
12
MEDIAN SOLD PRICE
$514,000
MEDIAN $ / SQ. FT.
$376
MEDIAN DAYS ON MARKET
30
SOLD VS. ORIGINAL LIST
95.8%
MONTH
May
CLOSED SALES
12
MEDIAN SOLD PRICE
$587,500
MEDIAN $ / SQ. FT.
$347
MEDIAN DAYS ON MARKET
20
SOLD VS. ORIGINAL LIST
97.9%
MONTH
June
CLOSED SALES
13
MEDIAN SOLD PRICE
$645,000
MEDIAN $ / SQ. FT.
$369
MEDIAN DAYS ON MARKET
24
SOLD VS. ORIGINAL LIST
96.8%
MONTH
July
CLOSED SALES
8
MEDIAN SOLD PRICE
$624,500
MEDIAN $ / SQ. FT.
$352
MEDIAN DAYS ON MARKET
32
SOLD VS. ORIGINAL LIST
96.6%
MONTH
August
CLOSED SALES
10
MEDIAN SOLD PRICE
$647,500
MEDIAN $ / SQ. FT.
$372
MEDIAN DAYS ON MARKET
16
SOLD VS. ORIGINAL LIST
100.4%
MONTH
September
CLOSED SALES
13
MEDIAN SOLD PRICE
$750,000
MEDIAN $ / SQ. FT.
$377
MEDIAN DAYS ON MARKET
28
SOLD VS. ORIGINAL LIST
94.9%
MONTH
October
CLOSED SALES
18
MEDIAN SOLD PRICE
$645,500
MEDIAN $ / SQ. FT.
$426
MEDIAN DAYS ON MARKET
17
SOLD VS. ORIGINAL LIST
99.4%
MONTH
November
CLOSED SALES
9
MEDIAN SOLD PRICE
$670,000
MEDIAN $ / SQ. FT.
$494
MEDIAN DAYS ON MARKET
48
SOLD VS. ORIGINAL LIST
98.6%
MONTH
December
CLOSED SALES
14
MEDIAN SOLD PRICE
$695,000
MEDIAN $ / SQ. FT.
$398
MEDIAN DAYS ON MARKET
55
SOLD VS. ORIGINAL LIST
95.3%
Closed Sales by Month
2021 · single-family homes
Where Homes Sold: Price Ranges
Closed single-family sales by price range, 2020 vs. 2021
Existing Homes vs. New Construction
Swipe sideways to see all columns →
HOME TYPE
SALES
MEDIAN PRICE
$ / SQ. FT.
MEDIAN DOM
HOME TYPE
Built before 1960
SALES
132
MEDIAN PRICE
$607,500
$ / SQ. FT.
$368
MEDIAN DOM
25
HOME TYPE
Built 1960–2017
SALES
17
MEDIAN PRICE
$600,000
$ / SQ. FT.
$351
MEDIAN DOM
30
HOME TYPE
New construction (2018–2021)
SALES
2
MEDIAN PRICE
$950,000
$ / SQ. FT.
$333
MEDIAN DOM
506
Shenandoah Closed Sales, 2021
151 single-family sales · highest price first
Swipe sideways to see all columns →
ADDRESS
CLOSED PRICE ▼
$ / LIVING SQ. FT.
BEDS / BATHS
LIVING SQ. FT.
LOT SQ. FT.
DAYS ON MARKET
SOLD VS. ORIGINAL LIST
CLOSING DATE
ADDRESS
1441 SW 11th Ter.
CLOSED PRICE
$1,300,100
$ / LIVING SQ. FT.
$631
BEDS / BATHS
3 / 2
LIVING SQ. FT.
2,062
LOT SQ. FT.
5,920
DAYS ON MARKET
20
SOLD VS. ORIGINAL LIST
86.7%
CLOSING DATE
Sept 13
ADDRESS
1804 SW 16th Ave.
CLOSED PRICE
$1,300,000
$ / LIVING SQ. FT.
$526
BEDS / BATHS
4 / 3
LIVING SQ. FT.
2,472
LOT SQ. FT.
7,103
DAYS ON MARKET
133
SOLD VS. ORIGINAL LIST
81.3%
CLOSING DATE
May 28
ADDRESS
2001 SW 13th St.
CLOSED PRICE
$1,198,500
$ / LIVING SQ. FT.
$343
BEDS / BATHS
7 / 4.5
LIVING SQ. FT.
3,490
LOT SQ. FT.
7,300
DAYS ON MARKET
192
SOLD VS. ORIGINAL LIST
98.3%
CLOSING DATE
Mar 15
ADDRESS
1516 SW 18th St.
CLOSED PRICE
$1,150,000
$ / LIVING SQ. FT.
$554
BEDS / BATHS
4 / 3
LIVING SQ. FT.
2,076
LOT SQ. FT.
6,750
DAYS ON MARKET
11
SOLD VS. ORIGINAL LIST
104.5%
CLOSING DATE
Nov 15
ADDRESS
1671 SW 16th St.
CLOSED PRICE
$1,050,000
$ / LIVING SQ. FT.
$632
BEDS / BATHS
4 / 3
LIVING SQ. FT.
1,661
LOT SQ. FT.
5,450
DAYS ON MARKET
14
SOLD VS. ORIGINAL LIST
106.1%
CLOSING DATE
Nov 17
ADDRESS
1130 SW 23rd Ave. FEATURED SOLD BY JORGE ▶︎ Video
CLOSED PRICE
$1,050,000
$ / LIVING SQ. FT.
$617
BEDS / BATHS
4 / 4.5
LIVING SQ. FT.
1,701
LOT SQ. FT.
6,000
DAYS ON MARKET
4
SOLD VS. ORIGINAL LIST
95.5%
CLOSING DATE
Dec 17
ADDRESS
1420 SW 11th St.
CLOSED PRICE
$1,000,000
$ / LIVING SQ. FT.
$397
BEDS / BATHS
4 / 3
LIVING SQ. FT.
2,520
LOT SQ. FT.
5,900
DAYS ON MARKET
129
SOLD VS. ORIGINAL LIST
83.3%
CLOSING DATE
Nov 1
ADDRESS
1015 SW 13th Ave.
CLOSED PRICE
$950,000
$ / LIVING SQ. FT.
$345
BEDS / BATHS
4 / 4
LIVING SQ. FT.
2,750
LOT SQ. FT.
7,800
DAYS ON MARKET
0
SOLD VS. ORIGINAL LIST
100.0%
CLOSING DATE
Sept 13
ADDRESS
1940 SW 12th Ave.
CLOSED PRICE
$950,000
$ / LIVING SQ. FT.
$321
BEDS / BATHS
4 / 4
LIVING SQ. FT.
2,956
LOT SQ. FT.
6,100
DAYS ON MARKET
1011
SOLD VS. ORIGINAL LIST
77.2%
CLOSING DATE
Jan 22
ADDRESS
1515 SW 11th St.
CLOSED PRICE
$930,000
$ / LIVING SQ. FT.
$436
BEDS / BATHS
4 / 3
LIVING SQ. FT.
2,135
LOT SQ. FT.
6,000
DAYS ON MARKET
48
SOLD VS. ORIGINAL LIST
103.3%
CLOSING DATE
Oct 26
ADDRESS
2480 SW 19th St.
CLOSED PRICE
$920,000
$ / LIVING SQ. FT.
$412
BEDS / BATHS
4 / 3.5
LIVING SQ. FT.
2,232
LOT SQ. FT.
5,650
DAYS ON MARKET
392
SOLD VS. ORIGINAL LIST
96.8%
CLOSING DATE
Jul 2
ADDRESS
1941 SW 18th Ave.
CLOSED PRICE
$915,000
$ / LIVING SQ. FT.
$377
BEDS / BATHS
4 / 3
LIVING SQ. FT.
2,429
LOT SQ. FT.
7,200
DAYS ON MARKET
46
SOLD VS. ORIGINAL LIST
98.9%
CLOSING DATE
Aug 31
ADDRESS
1715 SW 11th St.
CLOSED PRICE
$915,000
$ / LIVING SQ. FT.
$508
BEDS / BATHS
3 / 2
LIVING SQ. FT.
1,800
LOT SQ. FT.
5,875
DAYS ON MARKET
10
SOLD VS. ORIGINAL LIST
98.4%
CLOSING DATE
Dec 3
ADDRESS
1327 SW 16th St.
CLOSED PRICE
$900,000
$ / LIVING SQ. FT.
$466
BEDS / BATHS
3 / 2
LIVING SQ. FT.
1,932
LOT SQ. FT.
8,225
DAYS ON MARKET
5
SOLD VS. ORIGINAL LIST
104.0%
CLOSING DATE
Jun 3
ADDRESS
2018 SW 13th St.
CLOSED PRICE
$890,000
$ / LIVING SQ. FT.
$539
BEDS / BATHS
4 / 3.5
LIVING SQ. FT.
1,651
LOT SQ. FT.
7,300
DAYS ON MARKET
8
SOLD VS. ORIGINAL LIST
100.0%
CLOSING DATE
Aug 20
ADDRESS
1550 SW 16th Ave.
CLOSED PRICE
$890,000
$ / LIVING SQ. FT.
$617
BEDS / BATHS
3 / 2
LIVING SQ. FT.
1,442
LOT SQ. FT.
6,540
DAYS ON MARKET
8
SOLD VS. ORIGINAL LIST
101.3%
CLOSING DATE
Aug 2
ADDRESS
1867 SW 14th Ter.
CLOSED PRICE
$882,500
$ / LIVING SQ. FT.
$555
BEDS / BATHS
3 / 3.5
LIVING SQ. FT.
1,589
LOT SQ. FT.
7,725
DAYS ON MARKET
7
SOLD VS. ORIGINAL LIST
98.1%
CLOSING DATE
Oct 5
ADDRESS
1823 SW 18th Ave.
CLOSED PRICE
$875,000
$ / LIVING SQ. FT.
$332
BEDS / BATHS
5 / 4
LIVING SQ. FT.
2,633
LOT SQ. FT.
4,916
DAYS ON MARKET
62
SOLD VS. ORIGINAL LIST
92.1%
CLOSING DATE
Sept 2
ADDRESS
2401 SW 20th St.
CLOSED PRICE
$870,000
$ / LIVING SQ. FT.
BEDS / BATHS
5 / 4
LIVING SQ. FT.
LOT SQ. FT.
11,736
DAYS ON MARKET
9
SOLD VS. ORIGINAL LIST
99.4%
CLOSING DATE
Oct 6
ADDRESS
1837 SW 14th Ter.
CLOSED PRICE
$854,177
$ / LIVING SQ. FT.
$386
BEDS / BATHS
4 / 2
LIVING SQ. FT.
2,213
LOT SQ. FT.
10,300
DAYS ON MARKET
24
SOLD VS. ORIGINAL LIST
100.0%
CLOSING DATE
Jun 29
ADDRESS
1665 SW 11th St.
CLOSED PRICE
$849,000
$ / LIVING SQ. FT.
$529
BEDS / BATHS
3 / 2
LIVING SQ. FT.
1,604
LOT SQ. FT.
5,900
DAYS ON MARKET
48
SOLD VS. ORIGINAL LIST
100.0%
CLOSING DATE
Oct 21
ADDRESS
2121 SW 22nd Ave.
CLOSED PRICE
$840,000
$ / LIVING SQ. FT.
$237
BEDS / BATHS
4 / 3.5
LIVING SQ. FT.
3,540
LOT SQ. FT.
12,125
DAYS ON MARKET
62
SOLD VS. ORIGINAL LIST
84.0%
CLOSING DATE
Sept 20
ADDRESS
1864 SW 14th Ter.
CLOSED PRICE
$840,000
$ / LIVING SQ. FT.
$599
BEDS / BATHS
3 / 3
LIVING SQ. FT.
1,403
LOT SQ. FT.
5,150
DAYS ON MARKET
48
SOLD VS. ORIGINAL LIST
96.0%
CLOSING DATE
Nov 24
ADDRESS
1768 SW 15th St.
CLOSED PRICE
$830,000
$ / LIVING SQ. FT.
$378
BEDS / BATHS
3 / 3
LIVING SQ. FT.
2,194
LOT SQ. FT.
5,250
DAYS ON MARKET
12
SOLD VS. ORIGINAL LIST
94.9%
CLOSING DATE
Sept 10
ADDRESS
1761 SW 14th St.
CLOSED PRICE
$820,000
$ / LIVING SQ. FT.
$269
BEDS / BATHS
6 / 9
LIVING SQ. FT.
3,050
LOT SQ. FT.
9,375
DAYS ON MARKET
142
SOLD VS. ORIGINAL LIST
100.4%
CLOSING DATE
Dec 9
ADDRESS
All 151 sales · median
CLOSED PRICE
$605,000
$ / LIVING SQ. FT.
$361
BEDS / BATHS
LIVING SQ. FT.
1,665
LOT SQ. FT.
5,949
DAYS ON MARKET
28
SOLD VS. ORIGINAL LIST
97.5%
CLOSING DATE
Source: Southeast Florida MLS.
How the Month Compared
SHENANDOAH
PRIOR
MONTH
CHANGE
SHENANDOAH
–
PRIOR
–
MONTH
–
CHANGE
–
THE LAST 12 MONTHS
The Last 12 Months in Shenandoah
Chart
Chart
ALL SALES, ROLLING 12 MONTHS
Rolling 12-month figures are calculated from closed MLS sales.
The charts illustrate monthly price fluctuations, while the rolling 12-month figures reflect all qualifying closed sales during the period, providing a broader perspective on Shenandoah’s market.
What 2021 Means for Buyers and Sellers in Shenandoah
SELLERS
For sellers, 2021 was one of the strongest markets Shenandoah has seen. Well-priced homes drew multiple offers and sold in weeks, often at or above asking.
BUYERS
For buyers, competition was intense. With record-low rates and buyers arriving from out of state, being ready to move quickly and decisively was often the difference between winning and losing a home.
Text
YOUR SHENANDOAH HOME VALUE
Considering Selling a Home in Shenandoah?
Get a personalized valuation informed by current neighborhood sales and firsthand local experience.
Jorge Fernandez | The Shenandoah Guys | SERHANT.
About This Year in Review
This report analyzes single-family home sales and market activity in Shenandoah, Miami, for calendar year 2021, using Southeast Florida MLS data. Jorge Fernandez provides firsthand market analysis and local context to explain the why behind the data and what it means for Shenandoah homeowners, sellers and buyers.
REPORTING PERIOD
January 1 – December 31, 2021
MLS DATA CURRENT AS OF
—
PUBLISHED
—
DATA SOURCE
Southeast Florida MLS
Condominium and townhome sales are not included. Sales referenced may include properties in which Jorge Fernandez/The Shenandoah Guys at SERHANT. Florida LLC did not represent the buyer or seller. Information is provided for market analysis purposes.

REPORT PREPARED BY
Jorge Fernandez, REALTOR®
The Shenandoah Guys | SERHANT. Florida
Professional Recognition & Designations
2026 RealTrends Verified | Top 1.5% Nationwide
Certified Luxury Home Marketing Specialist (CLHMS™) | Million Dollar GUILD™
Master Brokers Forum | Advisory Board
Local Expertise
Miami Native | 21+ Years of Real Estate Experience | 10-Year Shenandoah Resident
Florida Real Estate License #SL3158278
Florida Real Estate License #SL3158278
The Shenandoah Guys | SERHANT. Florida
Miami Native | 21+ Years of Real Estate Experience | 10-Year Shenandoah Resident
← PREVIOUS REPORT
NEXT REPORT →