
YOUR NEIGHBORS IN REAL ESTATE


Hablamos Español


YEAR IN REVIEW
Shenandoah Miami Real Estate: 2020 Year in Review
By Jorge Fernandez, REALTOR®
Market data and analysis from Jorge Fernandez, Shenandoah resident and local real estate market expert, with The Shenandoah Guys at SERHANT.
A full-year look at Shenandoah single-family sales in 2020: prices, pace, negotiating power and how our neighborhood’s market changed compared with 2019.
2020 Shenandoah Real Estate at a Glance
Single-family homes · Southeast Florida MLS · Change vs. 2019
LABEL
—
—
LABEL
—
—
LABEL
—
—
LABEL
—
—
LABEL
—
—
Months of inventory
Calculation
MEDIAN SALE PRICE
$489,000
↑ 9.9% vs. 2019
MEDIAN SOLD $ / SQ. FT.
$322
↑ 14.2% vs. 2019
CLOSED SALES
119
↑ 4 vs. 2019
TOTAL SALES VOLUME
$61.5M
↑ 16.9% vs. 2019
SOLD VS. ORIGINAL LIST PRICE
95.1%
↑ 2.7 pts vs. 2019
MEDIAN DAYS ON MARKET
42
↓ 25 days vs. 2019
MARKET ACTIVITY
168
Homes Listed for Sale
↑ 1 vs. 2019
97.4%
Sold vs. Final List Price
↑ 2.4 pts vs. 2019
39%
Sold After Price Reduction
↓ 11 pts vs. 2019
—
Label
—
Label
Year to date
The 2020 Shenandoah Market in Review
Few years have turned as sharply as 2020. In the spring, the pandemic brought the market nearly to a standstill. By the end of the year, Shenandoah was in the middle of its busiest stretch in years. 119 single-family homes closed, up from 115 in 2019, and total sales volume rose 16.9% to $61.5 million. The median sale price rose 9.9% to $489,000, and the median price per square foot rose 14.2% to $322.
When COVID-19 reached South Florida in March, showings stopped, offices closed and many sellers pulled back. Only 17 homes closed in our neighborhood from April through June. In May, the Navy’s Blue Angels flew over Shenandoah as part of a salute to South Florida’s health care workers and first responders, a moment many of us watched from our front yards. The Federal Reserve had cut its benchmark rate to near zero in two emergency moves in March. Mortgage rates followed, falling below 3% for the first time in July and setting new record lows through the end of the year. Once buyers could see homes again, low rates and the sudden need for more space at home brought them back in force.
The rebound started in the summer. From August through December, 73 homes closed, more than in the first seven months of the year combined. The median home sold in 42 days, down from 67 in 2019, and the share of homes selling at or above asking more than doubled, from 11% to 24%. Buyers also negotiated less: the typical home sold at 95.1% of its original list price, up from 92.4%, and the share of sales needing a price reduction fell from 50% to 39%.
The top of the market began to stretch, too. Ten homes sold for $750,000 or more, up from three in 2019, led by 1641 SW 16th Street, a 1936 home that sold in November for $990,000, and 1930 SW 12th Avenue, a 2019 new build, at $960,000. Featured below is 2130 SW 21st Street, a home I represented, which closed in late March just as the pandemic shutdowns began, for $510,000.
Shenandoah Since 2016: The Long-Term Trend
2016 – 2020 · single-family homes · one point per year
Median Sale Price
Full-year median, 2016–2020
Median Price per Sq. Ft.
Full-year median, 2016–2020
Closed Sales per Year
Single-family homes
Sold vs. Original List Price
Median, as a percent of original asking price
FEATURED 2020 CLOSING
2130 SW 21st Street, Miami
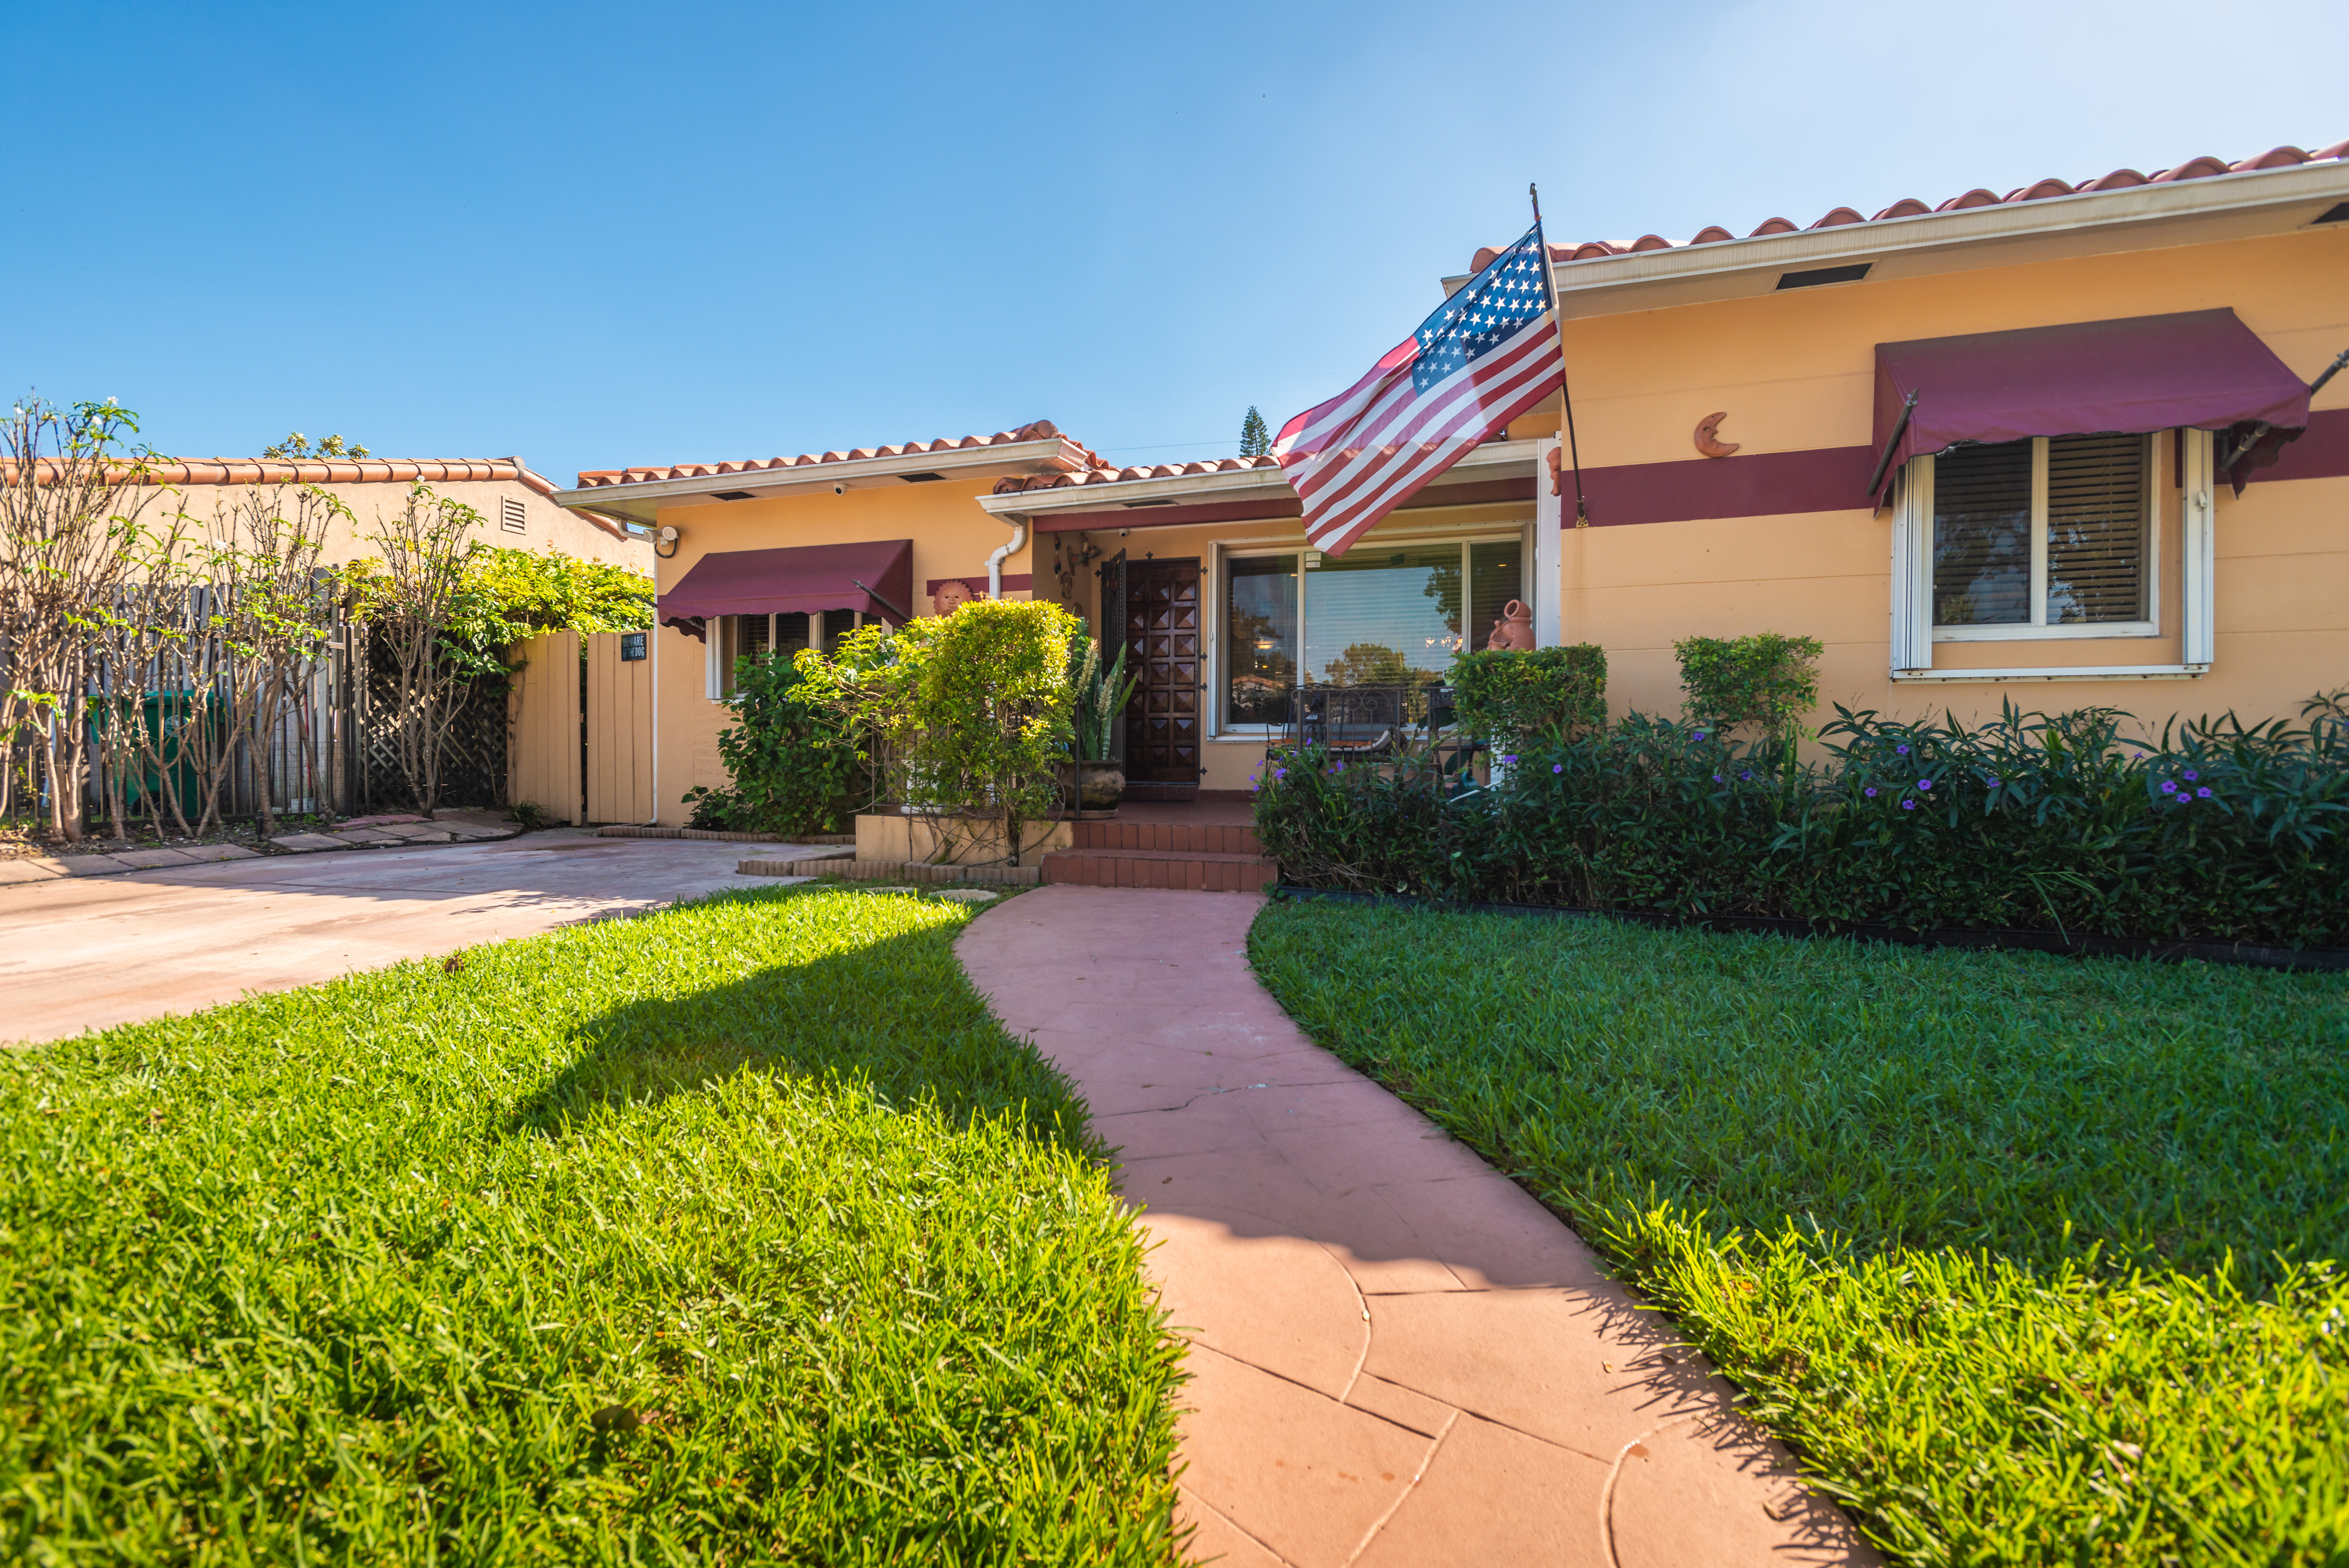
Featured Sale
Details
Bedrooms
3
Bathrooms
2
Living Area
1,402 sq. ft.
Lot Size
6,000 sq. ft.
Original List Price
$510,000
Sale Price
$510,000
Closing Date
March 24, 2020
Data sourced from the Miami MLS for closed sales analysis. This property was listed and sold by other cooperating MLS participant brokerages. SERHANT. Florida and Jorge Fernandez did not represent either party in this transaction and provide this data solely for local real estate market commentary.
Watch Property Video →
Write-up
FEATURED SHENANDOAH CLOSING
Featured closing

Sold by Jorge Fernandez
Details
Label
Value
Label
Value
Label
Value
Label
Value
Label
Value
Label
Value
Label
Value
Disclosure
Watch Property Video →
Write-up
FEATURED SHENANDOAH CLOSING
Featured closing
Sold by Jorge Fernandez
Details
Label
Value
Label
Value
Label
Value
Label
Value
Label
Value
Label
Value
Label
Value
Disclosure
Watch Property Video →
Write-up
Market Snapshot
Snapshot
How 2020 Compared With 2019
Shenandoah single-family homes
SHENANDOAH SINGLE-FAMILY
2019
2020
CHANGE
SHENANDOAH SINGLE-FAMILY
Closed sales
2019
115
2020
119
CHANGE
↑ 3%
SHENANDOAH SINGLE-FAMILY
Total sales volume
2019
$52.6M
2020
$61.5M
CHANGE
↑ 16.9%
SHENANDOAH SINGLE-FAMILY
Median sold price
2019
$445,000
2020
$489,000
CHANGE
↑ 9.9%
SHENANDOAH SINGLE-FAMILY
Median original asking price
2019
$485,000
2020
$535,000
CHANGE
↑ 10.3%
SHENANDOAH SINGLE-FAMILY
Median price / sq. ft.
2019
$282
2020
$322
CHANGE
↑ 14.2%
SHENANDOAH SINGLE-FAMILY
Sold vs. original list price
2019
92.4%
2020
95.1%
CHANGE
↑ 2.7 pts
SHENANDOAH SINGLE-FAMILY
Sold vs. final list price
2019
95.0%
2020
97.4%
CHANGE
↑ 2.4 pts
SHENANDOAH SINGLE-FAMILY
Median days on market
2019
67
2020
42
CHANGE
↓ 25 days
SHENANDOAH SINGLE-FAMILY
Sales after a price reduction
2019
50%
2020
39%
CHANGE
↓ 11 pts
SHENANDOAH SINGLE-FAMILY
Sold at or above asking
2019
11%
2020
24%
CHANGE
↑ 13 pts
SHENANDOAH SINGLE-FAMILY
Homes listed for sale
2019
167
2020
168
CHANGE
↑ 1%
SHENANDOAH SINGLE-FAMILY
Months of supply (approx.)
2019
5.9
2020
5.9
CHANGE
About even
SHENANDOAH SINGLE-FAMILY
Listings that sold (approx.)
2019
71%
2020
67%
CHANGE
↓ 4 pts
SHENANDOAH SINGLE-FAMILY
Median living area
2019
1,615 sq. ft.
2020
1,589 sq. ft.
CHANGE
↓ 2%
SHENANDOAH SINGLE-FAMILY
Median lot size
2019
6,052 sq. ft.
2020
5,928 sq. ft.
CHANGE
↓ 2%
Approximate figures are estimated from listings that expired or were cancelled without selling; homes relisted and sold within a year are counted as sold.
2020 Month by Month
Swipe sideways to see all columns →
MONTH
CLOSED SALES
MEDIAN SOLD PRICE
MEDIAN $ / SQ. FT.
MEDIAN DAYS ON MARKET
SOLD VS. ORIGINAL LIST
MONTH
January
CLOSED SALES
7
MEDIAN SOLD PRICE
$407,000
MEDIAN $ / SQ. FT.
$316
MEDIAN DAYS ON MARKET
72
SOLD VS. ORIGINAL LIST
91.7%
MONTH
February
CLOSED SALES
7
MEDIAN SOLD PRICE
$385,000
MEDIAN $ / SQ. FT.
$276
MEDIAN DAYS ON MARKET
71
SOLD VS. ORIGINAL LIST
90.6%
MONTH
March
CLOSED SALES
7
MEDIAN SOLD PRICE
$475,000
MEDIAN $ / SQ. FT.
$350
MEDIAN DAYS ON MARKET
38
SOLD VS. ORIGINAL LIST
94.4%
MONTH
April
CLOSED SALES
3
MEDIAN SOLD PRICE
$580,000
MEDIAN $ / SQ. FT.
$413
MEDIAN DAYS ON MARKET
8
SOLD VS. ORIGINAL LIST
97.7%
MONTH
May
CLOSED SALES
7
MEDIAN SOLD PRICE
$515,000
MEDIAN $ / SQ. FT.
$295
MEDIAN DAYS ON MARKET
52
SOLD VS. ORIGINAL LIST
92.5%
MONTH
June
CLOSED SALES
7
MEDIAN SOLD PRICE
$490,000
MEDIAN $ / SQ. FT.
$345
MEDIAN DAYS ON MARKET
70
SOLD VS. ORIGINAL LIST
96.0%
MONTH
July
CLOSED SALES
8
MEDIAN SOLD PRICE
$474,500
MEDIAN $ / SQ. FT.
$322
MEDIAN DAYS ON MARKET
68
SOLD VS. ORIGINAL LIST
96.9%
MONTH
August
CLOSED SALES
17
MEDIAN SOLD PRICE
$489,000
MEDIAN $ / SQ. FT.
$306
MEDIAN DAYS ON MARKET
38
SOLD VS. ORIGINAL LIST
92.3%
MONTH
September
CLOSED SALES
18
MEDIAN SOLD PRICE
$437,500
MEDIAN $ / SQ. FT.
$311
MEDIAN DAYS ON MARKET
52
SOLD VS. ORIGINAL LIST
93.7%
MONTH
October
CLOSED SALES
11
MEDIAN SOLD PRICE
$550,000
MEDIAN $ / SQ. FT.
$333
MEDIAN DAYS ON MARKET
9
SOLD VS. ORIGINAL LIST
99.1%
MONTH
November
CLOSED SALES
16
MEDIAN SOLD PRICE
$565,500
MEDIAN $ / SQ. FT.
$329
MEDIAN DAYS ON MARKET
54
SOLD VS. ORIGINAL LIST
96.2%
MONTH
December
CLOSED SALES
11
MEDIAN SOLD PRICE
$575,000
MEDIAN $ / SQ. FT.
$360
MEDIAN DAYS ON MARKET
11
SOLD VS. ORIGINAL LIST
96.6%
Closed Sales by Month
2020 · single-family homes
Where Homes Sold: Price Ranges
Closed single-family sales by price range, 2019 vs. 2020
Existing Homes vs. New Construction
Swipe sideways to see all columns →
HOME TYPE
SALES
MEDIAN PRICE
$ / SQ. FT.
MEDIAN DOM
HOME TYPE
Built before 1960
SALES
110
MEDIAN PRICE
$487,000
$ / SQ. FT.
$325
MEDIAN DOM
38
HOME TYPE
Built 1960–2016
SALES
6
MEDIAN PRICE
$475,000
$ / SQ. FT.
$301
MEDIAN DOM
52
HOME TYPE
New construction (2017–2020)
SALES
3
MEDIAN PRICE
$740,000
$ / SQ. FT.
$346
MEDIAN DOM
163
Shenandoah Closed Sales, 2020
119 single-family sales · highest price first
Swipe sideways to see all columns →
ADDRESS
CLOSED PRICE ▼
$ / LIVING SQ. FT.
BEDS / BATHS
LIVING SQ. FT.
LOT SQ. FT.
DAYS ON MARKET
SOLD VS. ORIGINAL LIST
CLOSING DATE
ADDRESS
1641 SW 16th St.
CLOSED PRICE
$990,000
$ / LIVING SQ. FT.
$453
BEDS / BATHS
4 / 3
LIVING SQ. FT.
2,184
LOT SQ. FT.
10,900
DAYS ON MARKET
88
SOLD VS. ORIGINAL LIST
86.1%
CLOSING DATE
Nov 16
ADDRESS
1930 SW 12th Ave.
CLOSED PRICE
$960,000
$ / LIVING SQ. FT.
$308
BEDS / BATHS
4 / 3
LIVING SQ. FT.
3,121
LOT SQ. FT.
6,400
DAYS ON MARKET
382
SOLD VS. ORIGINAL LIST
70.6%
CLOSING DATE
Oct 30
ADDRESS
1430 SW 12th Ave.
CLOSED PRICE
$935,000
$ / LIVING SQ. FT.
$352
BEDS / BATHS
4 / 3
LIVING SQ. FT.
2,654
LOT SQ. FT.
9,525
DAYS ON MARKET
11
SOLD VS. ORIGINAL LIST
95.9%
CLOSING DATE
Dec 23
ADDRESS
1511 SW 13th St.
CLOSED PRICE
$889,000
$ / LIVING SQ. FT.
$460
BEDS / BATHS
3 / 2
LIVING SQ. FT.
1,931
LOT SQ. FT.
8,625
DAYS ON MARKET
2
SOLD VS. ORIGINAL LIST
100.0%
CLOSING DATE
Nov 25
ADDRESS
1441 SW 11th Ter.
CLOSED PRICE
$814,900
$ / LIVING SQ. FT.
$461
BEDS / BATHS
3 / 2
LIVING SQ. FT.
1,767
LOT SQ. FT.
5,920
DAYS ON MARKET
3
SOLD VS. ORIGINAL LIST
100.0%
CLOSING DATE
Oct 8
ADDRESS
1255 SW 19th Ter.
CLOSED PRICE
$801,500
$ / LIVING SQ. FT.
$453
BEDS / BATHS
3 / 2
LIVING SQ. FT.
1,771
LOT SQ. FT.
5,928
DAYS ON MARKET
6
SOLD VS. ORIGINAL LIST
100.3%
CLOSING DATE
Dec 28
ADDRESS
2130 SW 21st Ave. FEATURED
CLOSED PRICE
$795,000
$ / LIVING SQ. FT.
$393
BEDS / BATHS
3 / 3
LIVING SQ. FT.
2,024
LOT SQ. FT.
6,500
DAYS ON MARKET
139
SOLD VS. ORIGINAL LIST
90.9%
CLOSING DATE
Sept 1
ADDRESS
2160 SW 20th St.
CLOSED PRICE
$760,000
$ / LIVING SQ. FT.
$300
BEDS / BATHS
4 / 3
LIVING SQ. FT.
2,536
LOT SQ. FT.
6,540
DAYS ON MARKET
10
SOLD VS. ORIGINAL LIST
97.7%
CLOSING DATE
Apr 3
ADDRESS
1895 SW 11th Ter.
CLOSED PRICE
$750,000
$ / LIVING SQ. FT.
$332
BEDS / BATHS
8 / 5
LIVING SQ. FT.
2,260
LOT SQ. FT.
6,735
DAYS ON MARKET
4
SOLD VS. ORIGINAL LIST
96.3%
CLOSING DATE
Sept 10
ADDRESS
2171 SW 20th St.
CLOSED PRICE
$750,000
$ / LIVING SQ. FT.
$460
BEDS / BATHS
4 / 4
LIVING SQ. FT.
1,630
LOT SQ. FT.
6,060
DAYS ON MARKET
35
SOLD VS. ORIGINAL LIST
95.5%
CLOSING DATE
Nov 23
ADDRESS
1401 SW 11th Ter.
CLOSED PRICE
$740,000
$ / LIVING SQ. FT.
$346
BEDS / BATHS
4 / 3
LIVING SQ. FT.
2,140
LOT SQ. FT.
5,268
DAYS ON MARKET
163
SOLD VS. ORIGINAL LIST
95.0%
CLOSING DATE
Nov 17
ADDRESS
1431 SW 13th St.
CLOSED PRICE
$740,000
$ / LIVING SQ. FT.
$414
BEDS / BATHS
3 / 3
LIVING SQ. FT.
1,789
LOT SQ. FT.
5,914
DAYS ON MARKET
8
SOLD VS. ORIGINAL LIST
95.5%
CLOSING DATE
Feb 13
ADDRESS
1375 SW 14th St.
CLOSED PRICE
$740,000
$ / LIVING SQ. FT.
$251
BEDS / BATHS
5 / 4
LIVING SQ. FT.
2,951
LOT SQ. FT.
7,250
DAYS ON MARKET
57
SOLD VS. ORIGINAL LIST
98.7%
CLOSING DATE
May 29
ADDRESS
2200 SW 16th Ter.
CLOSED PRICE
$730,000
$ / LIVING SQ. FT.
$391
BEDS / BATHS
4 / 4.5
LIVING SQ. FT.
1,866
LOT SQ. FT.
9,800
DAYS ON MARKET
135
SOLD VS. ORIGINAL LIST
85.9%
CLOSING DATE
Aug 26
ADDRESS
1510 SW 13th Ave.
CLOSED PRICE
$720,000
$ / LIVING SQ. FT.
$384
BEDS / BATHS
3 / 2
LIVING SQ. FT.
1,876
LOT SQ. FT.
18,125
DAYS ON MARKET
25
SOLD VS. ORIGINAL LIST
98.0%
CLOSING DATE
Aug 3
ADDRESS
1360 SW 16th St.
CLOSED PRICE
$720,000
$ / LIVING SQ. FT.
$284
BEDS / BATHS
3 / 3
LIVING SQ. FT.
2,538
LOT SQ. FT.
7,250
DAYS ON MARKET
200
SOLD VS. ORIGINAL LIST
90.1%
CLOSING DATE
Nov 30
ADDRESS
2170 SW 19th St.
CLOSED PRICE
$720,000
$ / LIVING SQ. FT.
$319
BEDS / BATHS
3 / 3.5
LIVING SQ. FT.
2,256
LOT SQ. FT.
13,000
DAYS ON MARKET
204
SOLD VS. ORIGINAL LIST
90.6%
CLOSING DATE
Feb 18
ADDRESS
1740 SW 18th St.
CLOSED PRICE
$700,000
$ / LIVING SQ. FT.
$258
BEDS / BATHS
5 / 4
LIVING SQ. FT.
2,718
LOT SQ. FT.
7,008
DAYS ON MARKET
230
SOLD VS. ORIGINAL LIST
96.6%
CLOSING DATE
Dec 4
ADDRESS
1776 SW 16th Ave.
CLOSED PRICE
$689,000
$ / LIVING SQ. FT.
$373
BEDS / BATHS
3 / 2
LIVING SQ. FT.
1,848
LOT SQ. FT.
8,580
DAYS ON MARKET
1
SOLD VS. ORIGINAL LIST
100.0%
CLOSING DATE
Nov 10
ADDRESS
1829 SW 11th Ter.
CLOSED PRICE
$685,000
$ / LIVING SQ. FT.
$384
BEDS / BATHS
5 / 2.5
LIVING SQ. FT.
1,784
LOT SQ. FT.
7,080
DAYS ON MARKET
8
SOLD VS. ORIGINAL LIST
100.0%
CLOSING DATE
Sept 8
ADDRESS
1671 SW 16th St.
CLOSED PRICE
$660,000
$ / LIVING SQ. FT.
$397
BEDS / BATHS
4 / 3
LIVING SQ. FT.
1,661
LOT SQ. FT.
5,450
DAYS ON MARKET
353
SOLD VS. ORIGINAL LIST
97.1%
CLOSING DATE
Jan 24
ADDRESS
1600 SW 14th Ter.
CLOSED PRICE
$630,000
$ / LIVING SQ. FT.
$269
BEDS / BATHS
4 / 3.5
LIVING SQ. FT.
2,345
LOT SQ. FT.
6,540
DAYS ON MARKET
18
SOLD VS. ORIGINAL LIST
93.3%
CLOSING DATE
Oct 19
ADDRESS
1667 SW 13th St.
CLOSED PRICE
$615,000
$ / LIVING SQ. FT.
$278
BEDS / BATHS
4 / 3
LIVING SQ. FT.
2,210
LOT SQ. FT.
5,900
DAYS ON MARKET
22
SOLD VS. ORIGINAL LIST
98.4%
CLOSING DATE
Nov 20
ADDRESS
2001 SW 19th St.
CLOSED PRICE
$595,000
$ / LIVING SQ. FT.
$359
BEDS / BATHS
4 / 3
LIVING SQ. FT.
1,656
LOT SQ. FT.
7,123
DAYS ON MARKET
158
SOLD VS. ORIGINAL LIST
94.6%
CLOSING DATE
May 21
ADDRESS
1429 SW 15th St.
CLOSED PRICE
$594,000
$ / LIVING SQ. FT.
$370
BEDS / BATHS
3 / 2
LIVING SQ. FT.
1,607
LOT SQ. FT.
5,450
DAYS ON MARKET
33
SOLD VS. ORIGINAL LIST
99.2%
CLOSING DATE
Dec 14
ADDRESS
All 119 sales · median
CLOSED PRICE
$489,000
$ / LIVING SQ. FT.
$322
BEDS / BATHS
LIVING SQ. FT.
1,589
LOT SQ. FT.
5,928
DAYS ON MARKET
42
SOLD VS. ORIGINAL LIST
95.1%
CLOSING DATE
Source: Southeast Florida MLS.
How the Month Compared
SHENANDOAH
PRIOR
MONTH
CHANGE
SHENANDOAH
–
PRIOR
–
MONTH
–
CHANGE
–
THE LAST 12 MONTHS
The Last 12 Months in Shenandoah
Chart
Chart
ALL SALES, ROLLING 12 MONTHS
Rolling 12-month figures are calculated from closed MLS sales.
The charts illustrate monthly price fluctuations, while the rolling 12-month figures reflect all qualifying closed sales during the period, providing a broader perspective on Shenandoah’s market.
What 2020 Means for Buyers and Sellers in Shenandoah
SELLERS
For sellers, 2020 showed how quickly conditions can change. Homes that came to market in the second half of the year met a wave of motivated buyers and sold faster, with less negotiation, than in 2019.
BUYERS
For buyers, record-low mortgage rates made homes more affordable month to month even as prices rose. Buyers who acted once the market reopened locked in historically low rates in our neighborhood.
Text
YOUR SHENANDOAH HOME VALUE
Considering Selling a Home in Shenandoah?
Get a personalized valuation informed by current neighborhood sales and firsthand local experience.
Jorge Fernandez | The Shenandoah Guys | SERHANT.
About This Year in Review
This report analyzes single-family home sales and market activity in Shenandoah, Miami, for calendar year 2020, using Southeast Florida MLS data. Jorge Fernandez provides firsthand market analysis and local context to explain the why behind the data and what it means for Shenandoah homeowners, sellers and buyers.
REPORTING PERIOD
January 1 – December 31, 2020
MLS DATA CURRENT AS OF
—
PUBLISHED
—
DATA SOURCE
Southeast Florida MLS
Condominium and townhome sales are not included. Sales referenced may include properties in which Jorge Fernandez/The Shenandoah Guys at SERHANT. Florida LLC did not represent the buyer or seller. Information is provided for market analysis purposes.

REPORT PREPARED BY
Jorge Fernandez, REALTOR®
The Shenandoah Guys | SERHANT. Florida
Professional Recognition & Designations
2026 RealTrends Verified | Top 1.5% Nationwide
Certified Luxury Home Marketing Specialist (CLHMS™) | Million Dollar GUILD™
Master Brokers Forum | Advisory Board
Local Expertise
Miami Native | 21+ Years of Real Estate Experience | 10-Year Shenandoah Resident
Florida Real Estate License #SL3158278
Florida Real Estate License #SL3158278
The Shenandoah Guys | SERHANT. Florida
Miami Native | 21+ Years of Real Estate Experience | 10-Year Shenandoah Resident
← PREVIOUS REPORT
NEXT REPORT →