
YOUR NEIGHBORS IN REAL ESTATE


Hablamos Español


YEAR IN REVIEW
Shenandoah Miami Real Estate: 2025 Year in Review
By Jorge Fernandez, REALTOR®
Market data and analysis from Jorge Fernandez, Shenandoah resident and local real estate market expert, with The Shenandoah Guys at SERHANT.
A full-year look at Shenandoah single-family sales in 2025: prices, pace, negotiating power and how our neighborhood’s market changed compared with 2024.
2025 Shenandoah Real Estate at a Glance
Single-family homes · Southeast Florida MLS · Change vs. 2024
LABEL
—
—
LABEL
—
—
LABEL
—
—
LABEL
—
—
LABEL
—
—
Months of inventory
Calculation
MEDIAN SALE PRICE
$900,000
↑ 2.4% vs. 2024
MEDIAN SOLD $ / SQ. FT.
$555
↑ 3.2% vs. 2024
CLOSED SALES
105
↓ 3 vs. 2024
TOTAL SALES VOLUME
$109.1M
↑ 6.1% vs. 2024
SOLD VS. ORIGINAL LIST PRICE
91.3%
↓ 2.0 pts vs. 2024
MEDIAN DAYS ON MARKET
68
↑ 20 days vs. 2024
MARKET ACTIVITY
168
Homes Listed for Sale
↑ 24 vs. 2024
94.7%
Sold vs. Final List Price
↓ 0.7 pts vs. 2024
49%
Sold After Price Reduction
↑ 13 pts vs. 2024
—
Label
—
Label
Year to date
The 2025 Shenandoah Market in Review
2025 was a year of more choices and more negotiating in Shenandoah, but values held. 105 single-family homes closed, about the same as 108 in 2024. Total sales volume rose 6.1% to $109.1 million, the highest of any year since at least 2016. The median sale price rose 2.4% to $900,000, and the median price per square foot rose 3.2% to $555. That matched Miami-Dade County as a whole, where the single-family median rose 2.3% to $665,000.
Mortgage rates set the tone again. Thirty-year rates passed 7% in mid-January, then eased through most of the year. The Federal Reserve held steady through the summer, then cut rates in September, October and December. By early December, thirty-year rates averaged about 6.2%, near their lowest level of the year. Lower rates helped, but buyers had more homes to choose from and took their time.
More homes came to market. 168 Shenandoah homes were listed for sale, up from 144, and supply rose to roughly 6.8 months from 4.8. Homes took longer to sell, at a median of 68 days on market vs. 48. Nearly half of all sales, 49%, came after a price reduction, up from 36%. Only 16% sold at or above their final asking price, down from 25%. The typical home closed at 91.3% of its original list price. Buyers had real leverage in 2025, and well-priced homes were the ones that moved.
At the same time, our neighborhood’s upper end kept growing. Sales under $750,000 fell again, from 28 to 18. Sales of $2 million and above went from none in 2024 to five. Nine new-construction homes sold at a median of $1,825,000, or $689 per square foot. Yet the year’s top sale was a 1939 home: 1375 SW 17th Terrace sold in October for $2,280,000. Featured below are homes I represented in 2025. 1926 SW 17th Terrace sold in June for $1,000,000, about $801 per square foot. It was the 3rd highest closed sale price per square foot in Shenandoah for 2025 as of the sale date. 2019 SW 17th Terrace sold in June for $925,000, and 2305 SW 19th Terrace sold in October for $910,000.
2025 was a year to celebrate our neighborhood, too. In February, Dr. Paul George led another historic walking tour of Shenandoah as part of the annual Shenandoah Days, organized by the Miami Shenandoah Neighborhood Association. And in October, we were proud to sponsor and take part in both Halloween at Shenandoah Park and the 7th Annual Halloween on Coral Way, organized by the Miami Shenandoah Neighborhood Association and the Silver Bluff Neighborhood Association.
Shenandoah Since 2016: The Long-Term Trend
2016 – 2025 · single-family homes · one point per year
Median Sale Price
Full-year median, 2016–2025
Median Price per Sq. Ft.
Full-year median, 2016–2025
Closed Sales per Year
Single-family homes
Sold vs. Original List Price
Median, as a percent of original asking price
FEATURED 2025 CLOSINGS
1926 SW 17th Terrace, Miami
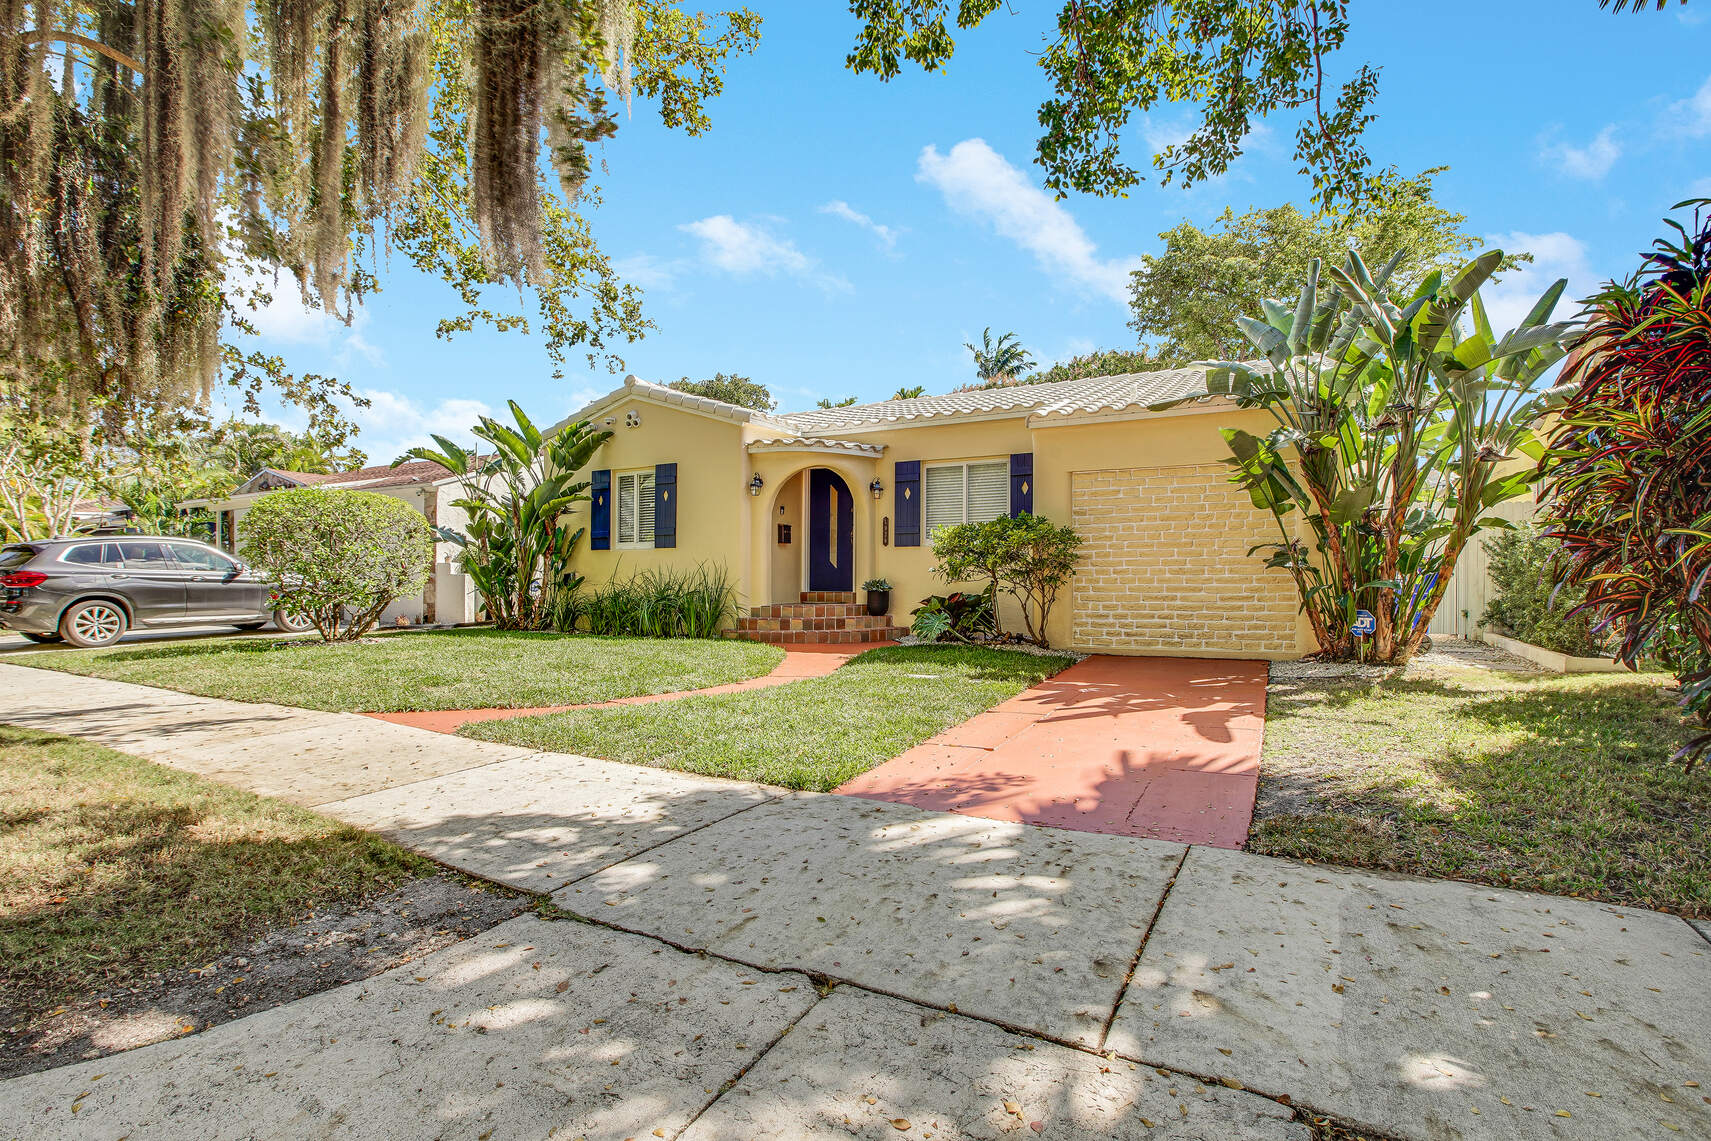
Sold | Listed by Jorge Fernandez
The Shenandoah Guys
Details
Bedrooms
3
Bathrooms
2
Living Area
1,248 sq. ft.
Lot Size
5,800 sq. ft.
Original List Price
$1,200,000
Sale Price
$1,000,000
Closing Date
June 5, 2025
Disclosure
Write-up
FEATURED SHENANDOAH CLOSING
2019 SW 17th Terrace, Miami
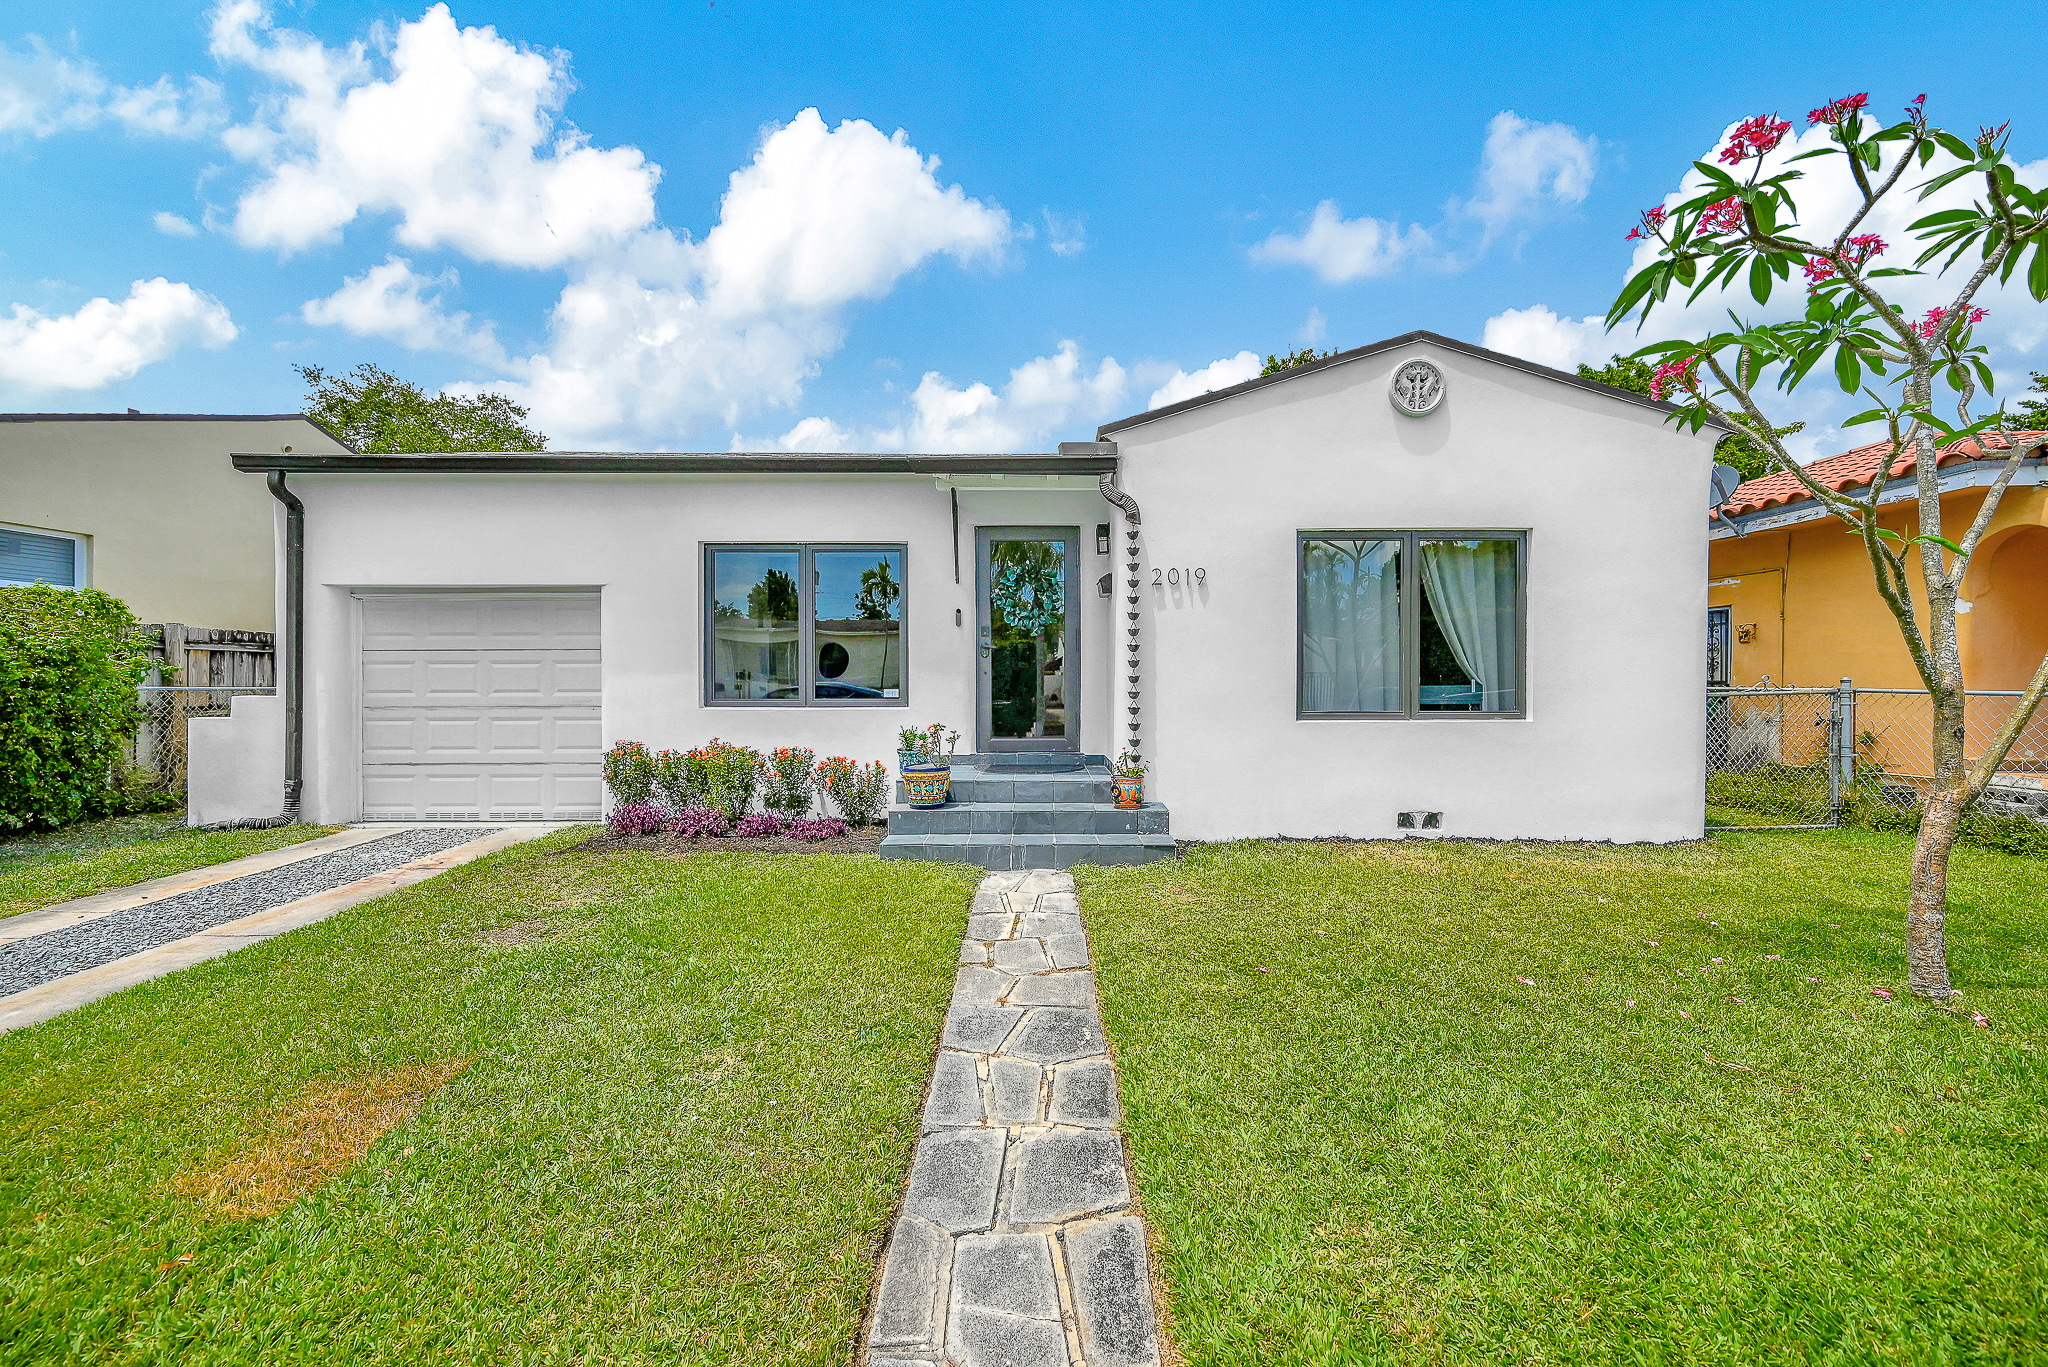
Sold | Listed by Jorge Fernandez
The Shenandoah Guys
Details
Bedrooms
2
Bathrooms
2
Living Area
1,476 sq. ft.
Lot Size
5,800 sq. ft.
Original List Price
$969,000
Sale Price
$925,000
Closing Date
June 11, 2025
Disclosure
Write-up
FEATURED SHENANDOAH CLOSING
2305 SW 19th Terrace, Miami
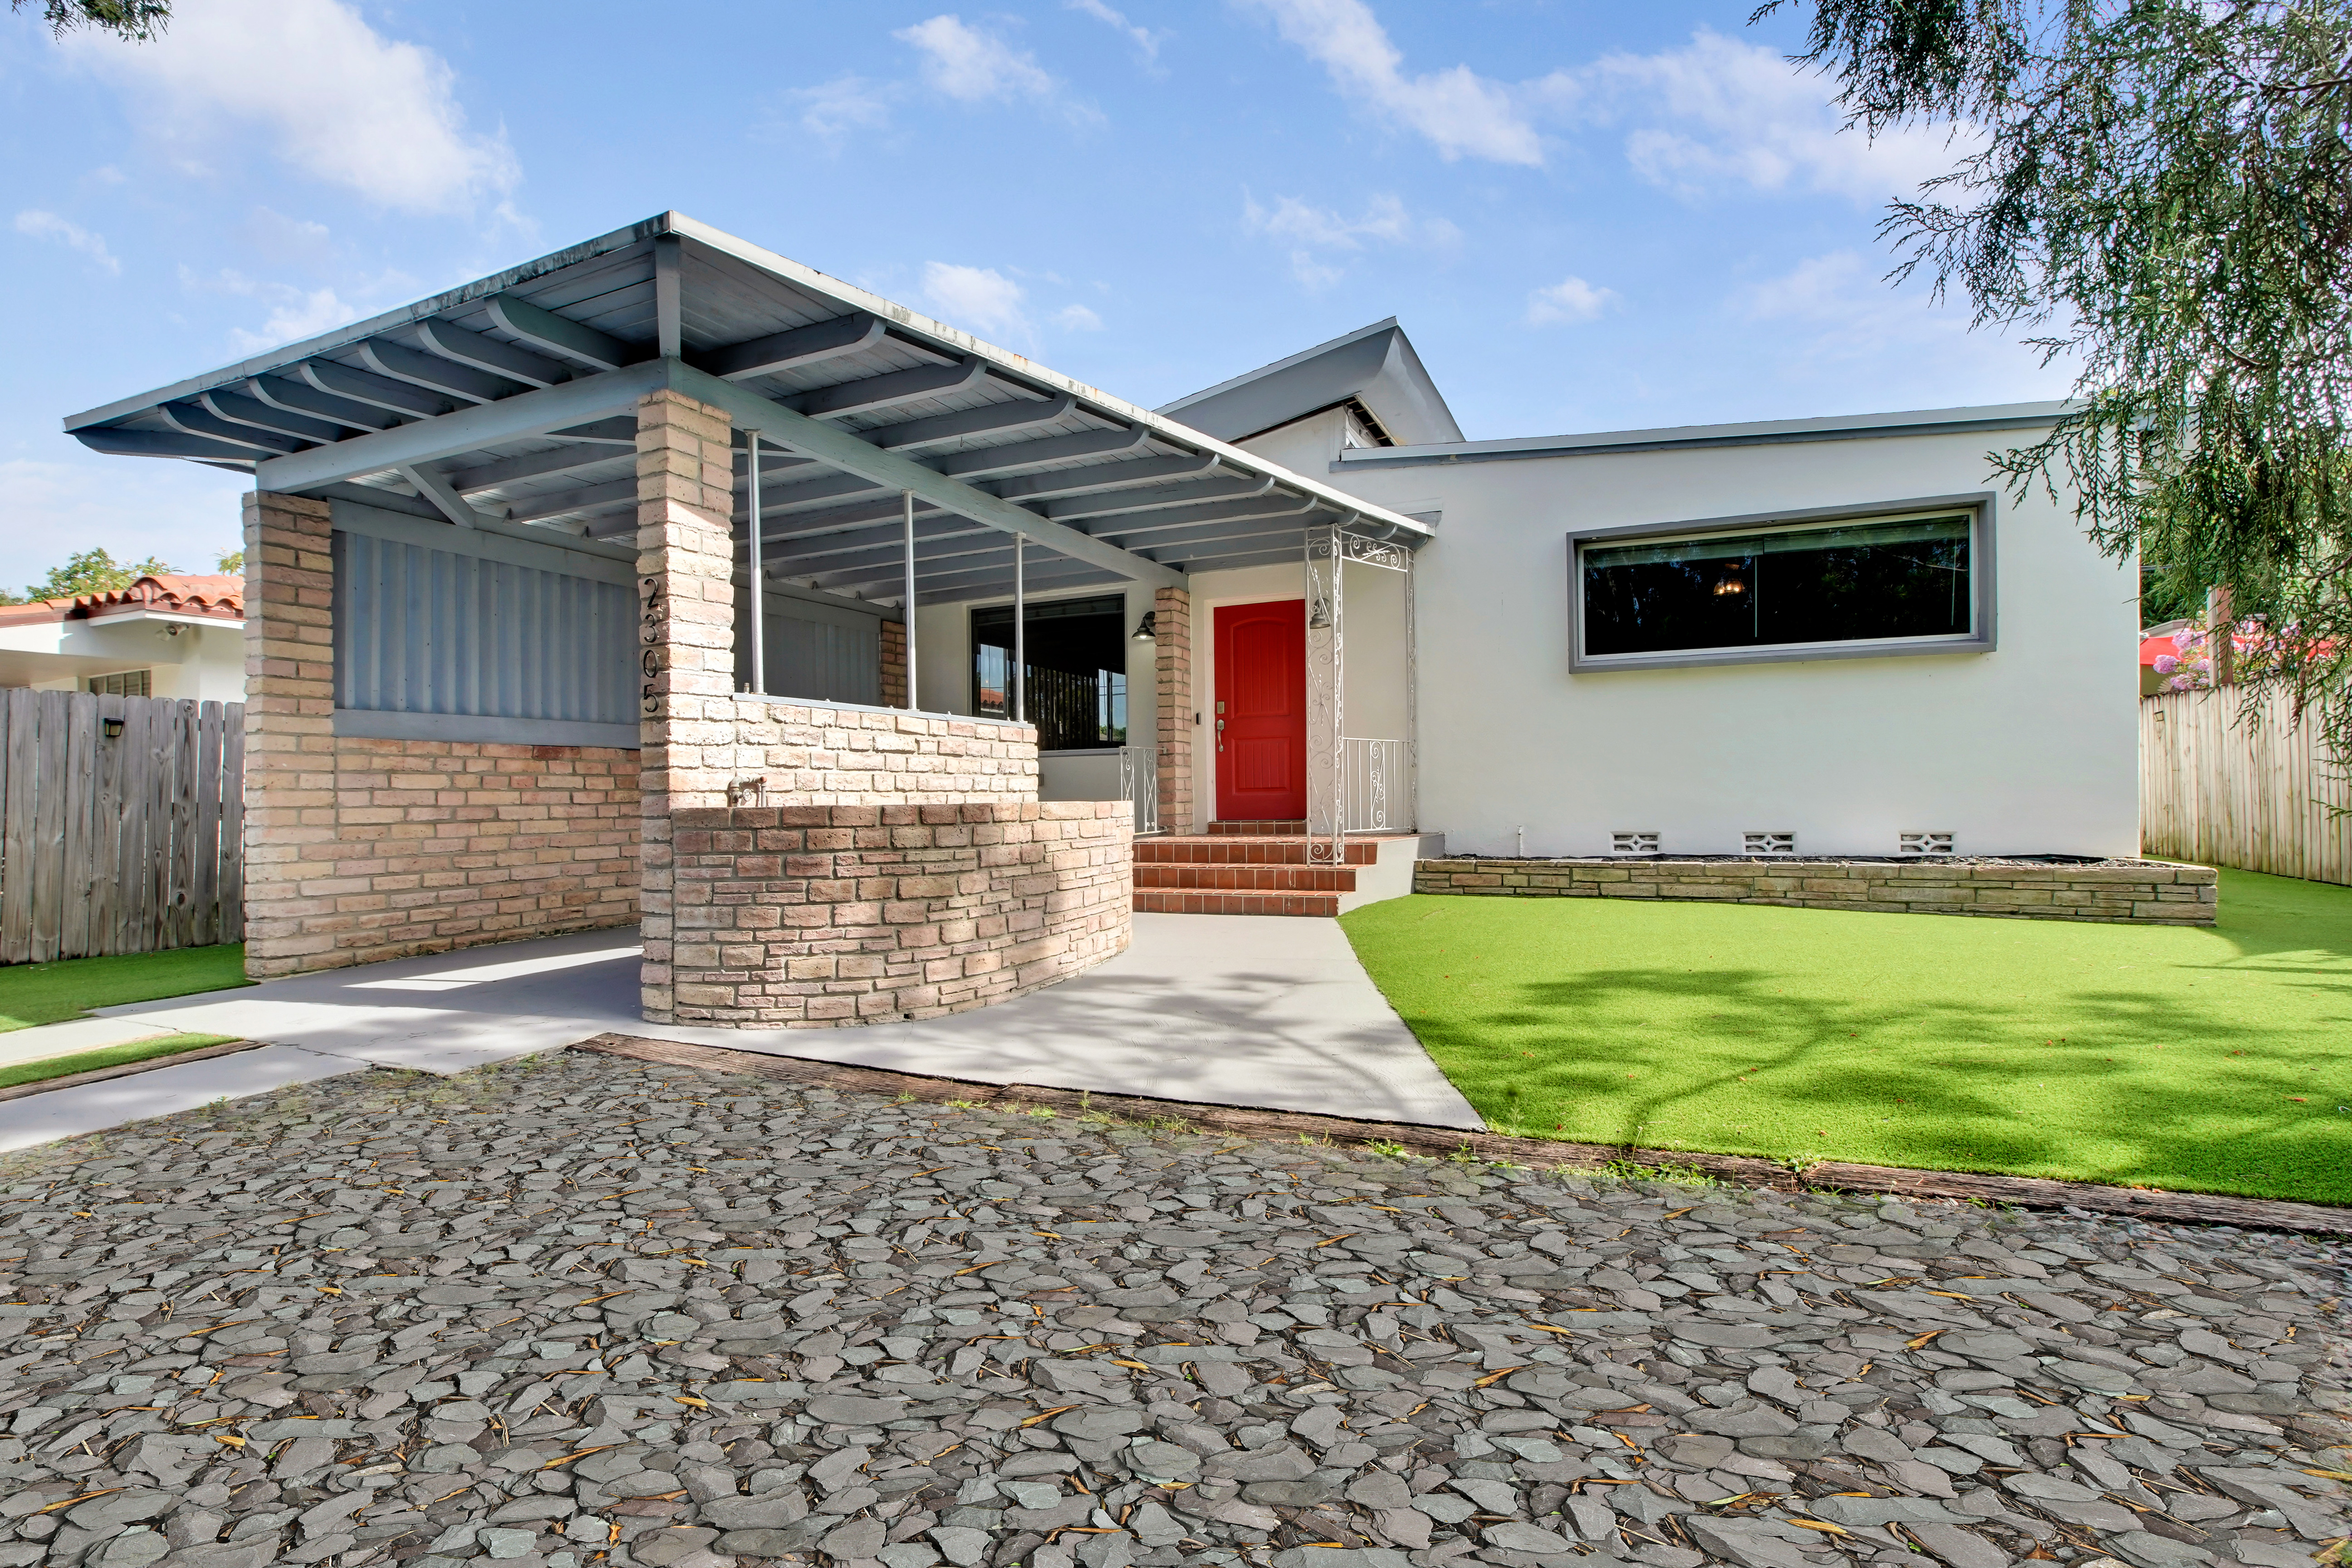
Sold | Listed by Jorge Fernandez
The Shenandoah Guys
Details
Bedrooms
2
Bathrooms
2
Living Area
1,331 sq. ft.
Lot Size
5,500 sq. ft.
Original List Price
$969,000
Sale Price
$910,000
Closing Date
October 10, 2025
Disclosure
Write-up
Market Snapshot
Snapshot
How 2025 Compared With 2024
Shenandoah single-family homes
SHENANDOAH SINGLE-FAMILY
2024
2025
CHANGE
SHENANDOAH SINGLE-FAMILY
Closed sales
2024
108
2025
105
CHANGE
↓ 3%
SHENANDOAH SINGLE-FAMILY
Total sales volume
2024
$102.8M
2025
$109.1M
CHANGE
↑ 6.1%
SHENANDOAH SINGLE-FAMILY
Median sold price
2024
$879,000
2025
$900,000
CHANGE
↑ 2.4%
SHENANDOAH SINGLE-FAMILY
Median original asking price
2024
$927,500
2025
$1,024,450
CHANGE
↑ 10.5%
SHENANDOAH SINGLE-FAMILY
Median price / sq. ft.
2024
$538
2025
$555
CHANGE
↑ 3.2%
SHENANDOAH SINGLE-FAMILY
Sold vs. original list price
2024
93.3%
2025
91.3%
CHANGE
↓ 2.0 pts
SHENANDOAH SINGLE-FAMILY
Sold vs. final list price
2024
95.4%
2025
94.7%
CHANGE
↓ 0.7 pts
SHENANDOAH SINGLE-FAMILY
Median days on market
2024
48
2025
68
CHANGE
↑ 20 days
SHENANDOAH SINGLE-FAMILY
Sales after a price reduction
2024
36%
2025
49%
CHANGE
↑ 13 pts
SHENANDOAH SINGLE-FAMILY
Sold at or above asking
2024
25%
2025
16%
CHANGE
↓ 9 pts
SHENANDOAH SINGLE-FAMILY
Homes listed for sale
2024
144
2025
168
CHANGE
↑ 17%
SHENANDOAH SINGLE-FAMILY
Months of supply (approx.)
2024
4.8
2025
6.8
CHANGE
↑ 2.0
SHENANDOAH SINGLE-FAMILY
Listings that sold (approx.)
2024
63%
2025
63%
CHANGE
→ 0
SHENANDOAH SINGLE-FAMILY
Median living area
2024
1,714 sq. ft.
2025
1,818 sq. ft.
CHANGE
↑ 6%
SHENANDOAH SINGLE-FAMILY
Median lot size
2024
5,914 sq. ft.
2025
5,900 sq. ft.
CHANGE
→ 0
Approximate figures are estimated from listings that expired or were cancelled without selling; homes relisted and sold within a year are counted as sold.
2025 Month by Month
Swipe sideways to see all columns →
MONTH
CLOSED SALES
MEDIAN SOLD PRICE
MEDIAN $ / SQ. FT.
MEDIAN DAYS ON MARKET
SOLD VS. ORIGINAL LIST
MONTH
January
CLOSED SALES
6
MEDIAN SOLD PRICE
$795,000
MEDIAN $ / SQ. FT.
$526
MEDIAN DAYS ON MARKET
92
SOLD VS. ORIGINAL LIST
87.6%
MONTH
February
CLOSED SALES
8
MEDIAN SOLD PRICE
$912,500
MEDIAN $ / SQ. FT.
$449
MEDIAN DAYS ON MARKET
104
SOLD VS. ORIGINAL LIST
87.8%
MONTH
March
CLOSED SALES
10
MEDIAN SOLD PRICE
$819,500
MEDIAN $ / SQ. FT.
$519
MEDIAN DAYS ON MARKET
10
SOLD VS. ORIGINAL LIST
93.2%
MONTH
April
CLOSED SALES
6
MEDIAN SOLD PRICE
$815,000
MEDIAN $ / SQ. FT.
$642
MEDIAN DAYS ON MARKET
70
SOLD VS. ORIGINAL LIST
89.6%
MONTH
May
CLOSED SALES
10
MEDIAN SOLD PRICE
$997,500
MEDIAN $ / SQ. FT.
$576
MEDIAN DAYS ON MARKET
60
SOLD VS. ORIGINAL LIST
95.0%
MONTH
June
CLOSED SALES
9
MEDIAN SOLD PRICE
$925,000
MEDIAN $ / SQ. FT.
$645
MEDIAN DAYS ON MARKET
71
SOLD VS. ORIGINAL LIST
89.0%
MONTH
July
CLOSED SALES
11
MEDIAN SOLD PRICE
$900,000
MEDIAN $ / SQ. FT.
$536
MEDIAN DAYS ON MARKET
34
SOLD VS. ORIGINAL LIST
86.5%
MONTH
August
CLOSED SALES
9
MEDIAN SOLD PRICE
$1,134,000
MEDIAN $ / SQ. FT.
$572
MEDIAN DAYS ON MARKET
81
SOLD VS. ORIGINAL LIST
93.1%
MONTH
September
CLOSED SALES
6
MEDIAN SOLD PRICE
$1,060,000
MEDIAN $ / SQ. FT.
$552
MEDIAN DAYS ON MARKET
90
SOLD VS. ORIGINAL LIST
90.2%
MONTH
October
CLOSED SALES
16
MEDIAN SOLD PRICE
$930,000
MEDIAN $ / SQ. FT.
$540
MEDIAN DAYS ON MARKET
111
SOLD VS. ORIGINAL LIST
91.1%
MONTH
November
CLOSED SALES
6
MEDIAN SOLD PRICE
$717,500
MEDIAN $ / SQ. FT.
$470
MEDIAN DAYS ON MARKET
22
SOLD VS. ORIGINAL LIST
93.2%
MONTH
December
CLOSED SALES
8
MEDIAN SOLD PRICE
$1,445,000
MEDIAN $ / SQ. FT.
$597
MEDIAN DAYS ON MARKET
47
SOLD VS. ORIGINAL LIST
92.5%
Closed Sales by Month
2025 · single-family homes
Where Homes Sold: Price Ranges
Closed single-family sales by price range, 2024 vs. 2025
Existing Homes vs. New Construction
Swipe sideways to see all columns →
HOME TYPE
SALES
MEDIAN PRICE
$ / SQ. FT.
MEDIAN DOM
HOME TYPE
Built before 1960
SALES
85
MEDIAN PRICE
$880,000
$ / SQ. FT.
$552
MEDIAN DOM
66
HOME TYPE
Built 1960–2021
SALES
11
MEDIAN PRICE
$950,000
$ / SQ. FT.
$515
MEDIAN DOM
82
HOME TYPE
New construction (2022–2025)
SALES
9
MEDIAN PRICE
$1,825,000
$ / SQ. FT.
$689
MEDIAN DOM
68
Shenandoah Closed Sales, 2025
105 single-family sales · highest price first
Swipe sideways to see all columns →
ADDRESS
CLOSED PRICE ▼
$ / LIVING SQ. FT.
BEDS / BATHS
LIVING SQ. FT.
LOT SQ. FT.
DAYS ON MARKET
SOLD VS. ORIGINAL LIST
CLOSING DATE
ADDRESS
1375 SW 17th Ter.
CLOSED PRICE
$2,280,000
$ / LIVING SQ. FT.
$672
BEDS / BATHS
4 / 4.5
LIVING SQ. FT.
3,395
LOT SQ. FT.
13,680
DAYS ON MARKET
502
SOLD VS. ORIGINAL LIST
79.3%
CLOSING DATE
Oct 22
ADDRESS
1509 SW 15th St.
CLOSED PRICE
$2,250,000
$ / LIVING SQ. FT.
$725
BEDS / BATHS
4 / 3.5
LIVING SQ. FT.
3,104
LOT SQ. FT.
5,450
DAYS ON MARKET
81
SOLD VS. ORIGINAL LIST
94.7%
CLOSING DATE
Aug 22
ADDRESS
1439 SW 15th St.
CLOSED PRICE
$2,200,000
$ / LIVING SQ. FT.
$734
BEDS / BATHS
5 / 4.5
LIVING SQ. FT.
2,999
LOT SQ. FT.
5,450
DAYS ON MARKET
53
SOLD VS. ORIGINAL LIST
90.7%
CLOSING DATE
Apr 15
ADDRESS
1513 SW 11th Ter.
CLOSED PRICE
$2,075,000
$ / LIVING SQ. FT.
$689
BEDS / BATHS
5 / 4.5
LIVING SQ. FT.
3,013
LOT SQ. FT.
5,900
DAYS ON MARKET
181
SOLD VS. ORIGINAL LIST
94.4%
CLOSING DATE
Dec 30
ADDRESS
1510 SW 15th St.
CLOSED PRICE
$2,070,000
$ / LIVING SQ. FT.
$755
BEDS / BATHS
4 / 3.5
LIVING SQ. FT.
2,742
LOT SQ. FT.
5,450
DAYS ON MARKET
279
SOLD VS. ORIGINAL LIST
96.7%
CLOSING DATE
Aug 28
ADDRESS
1801 SW 12th St.
CLOSED PRICE
$1,900,000
$ / LIVING SQ. FT.
$552
BEDS / BATHS
5 / 3.5
LIVING SQ. FT.
3,444
LOT SQ. FT.
12,626
DAYS ON MARKET
133
SOLD VS. ORIGINAL LIST
69.1%
CLOSING DATE
Oct 30
ADDRESS
1819 SW 11th Ter.
CLOSED PRICE
$1,825,000
$ / LIVING SQ. FT.
$632
BEDS / BATHS
5 / 5.5
LIVING SQ. FT.
2,887
LOT SQ. FT.
5,900
DAYS ON MARKET
35
SOLD VS. ORIGINAL LIST
96.1%
CLOSING DATE
Dec 16
ADDRESS
1860 SW 12th St.
CLOSED PRICE
$1,800,000
$ / LIVING SQ. FT.
$668
BEDS / BATHS
4 / 3.5
LIVING SQ. FT.
2,695
LOT SQ. FT.
8,850
DAYS ON MARKET
51
SOLD VS. ORIGINAL LIST
100.0%
CLOSING DATE
Oct 3
ADDRESS
1122 SW 13th Ave.
CLOSED PRICE
$1,750,000
$ / LIVING SQ. FT.
$576
BEDS / BATHS
4 / 4
LIVING SQ. FT.
3,040
LOT SQ. FT.
3,375
DAYS ON MARKET
196
SOLD VS. ORIGINAL LIST
89.7%
CLOSING DATE
May 28
ADDRESS
1420 SW 17th St.
CLOSED PRICE
$1,700,000
$ / LIVING SQ. FT.
$698
BEDS / BATHS
4 / 4
LIVING SQ. FT.
2,436
LOT SQ. FT.
5,450
DAYS ON MARKET
28
SOLD VS. ORIGINAL LIST
94.7%
CLOSING DATE
Apr 7
ADDRESS
2268 SW 16th Ter.
CLOSED PRICE
$1,650,000
$ / LIVING SQ. FT.
$615
BEDS / BATHS
5 / 4
LIVING SQ. FT.
2,682
LOT SQ. FT.
5,450
DAYS ON MARKET
68
SOLD VS. ORIGINAL LIST
97.4%
CLOSING DATE
May 28
ADDRESS
2467 SW 13th St.
CLOSED PRICE
$1,600,000
$ / LIVING SQ. FT.
$711
BEDS / BATHS
4 / 3.5
LIVING SQ. FT.
2,251
LOT SQ. FT.
6,900
DAYS ON MARKET
71
SOLD VS. ORIGINAL LIST
89.0%
CLOSING DATE
Jun 24
ADDRESS
2341 SW 16th Ter.
CLOSED PRICE
$1,550,000
$ / LIVING SQ. FT.
$575
BEDS / BATHS
4 / 4.5
LIVING SQ. FT.
2,694
LOT SQ. FT.
5,450
DAYS ON MARKET
132
SOLD VS. ORIGINAL LIST
93.9%
CLOSING DATE
Jul 9
ADDRESS
1267 SW 19th St.
CLOSED PRICE
$1,505,000
$ / LIVING SQ. FT.
$826
BEDS / BATHS
3 / 2.5
LIVING SQ. FT.
1,822
LOT SQ. FT.
5,928
DAYS ON MARKET
0
SOLD VS. ORIGINAL LIST
94.7%
CLOSING DATE
Jul 14
ADDRESS
1456 SW 13th St.
CLOSED PRICE
$1,485,000
$ / LIVING SQ. FT.
$677
BEDS / BATHS
3 / 3
LIVING SQ. FT.
2,192
LOT SQ. FT.
10,200
DAYS ON MARKET
145
SOLD VS. ORIGINAL LIST
67.8%
CLOSING DATE
Dec 3
ADDRESS
1244 SW 14th St.
CLOSED PRICE
$1,450,000
$ / LIVING SQ. FT.
$718
BEDS / BATHS
4 / 3
LIVING SQ. FT.
2,020
LOT SQ. FT.
6,555
DAYS ON MARKET
24
SOLD VS. ORIGINAL LIST
97.3%
CLOSING DATE
Dec 10
ADDRESS
1436 SW 16th St.
CLOSED PRICE
$1,445,000
$ / LIVING SQ. FT.
$645
BEDS / BATHS
3 / 2.5
LIVING SQ. FT.
2,242
LOT SQ. FT.
5,450
DAYS ON MARKET
15
SOLD VS. ORIGINAL LIST
91.7%
CLOSING DATE
Jun 23
ADDRESS
1515 SW 10th St.
CLOSED PRICE
$1,440,000
$ / LIVING SQ. FT.
$561
BEDS / BATHS
3 / 4
LIVING SQ. FT.
2,566
LOT SQ. FT.
5,900
DAYS ON MARKET
59
SOLD VS. ORIGINAL LIST
90.6%
CLOSING DATE
Dec 23
ADDRESS
1884 SW 17th St.
CLOSED PRICE
$1,400,000
$ / LIVING SQ. FT.
$572
BEDS / BATHS
4 / 3
LIVING SQ. FT.
2,448
LOT SQ. FT.
5,700
DAYS ON MARKET
460
SOLD VS. ORIGINAL LIST
66.7%
CLOSING DATE
Aug 28
ADDRESS
1414 SW 19th Ave.
CLOSED PRICE
$1,390,000
$ / LIVING SQ. FT.
$411
BEDS / BATHS
5 / 4.5
LIVING SQ. FT.
3,381
LOT SQ. FT.
15,120
DAYS ON MARKET
101
SOLD VS. ORIGINAL LIST
89.7%
CLOSING DATE
Feb 26
ADDRESS
1130 SW 23rd Ave.
CLOSED PRICE
$1,370,000
$ / LIVING SQ. FT.
$588
BEDS / BATHS
4 / 4.5
LIVING SQ. FT.
2,328
LOT SQ. FT.
6,000
DAYS ON MARKET
28
SOLD VS. ORIGINAL LIST
94.5%
CLOSING DATE
Sept 24
ADDRESS
1145 SW 20th Ave.
CLOSED PRICE
$1,360,100
$ / LIVING SQ. FT.
$582
BEDS / BATHS
5 / 3.5
LIVING SQ. FT.
2,336
LOT SQ. FT.
7,100
DAYS ON MARKET
221
SOLD VS. ORIGINAL LIST
83.7%
CLOSING DATE
Oct 15
ADDRESS
2344 SW 11th St.
CLOSED PRICE
$1,282,125
$ / LIVING SQ. FT.
$710
BEDS / BATHS
4 / 3
LIVING SQ. FT.
1,805
LOT SQ. FT.
5,600
DAYS ON MARKET
0
SOLD VS. ORIGINAL LIST
95.0%
CLOSING DATE
Aug 7
ADDRESS
1754 SW 14th Ter.
CLOSED PRICE
$1,225,000
$ / LIVING SQ. FT.
$515
BEDS / BATHS
4 / 4
LIVING SQ. FT.
2,379
LOT SQ. FT.
5,250
DAYS ON MARKET
96
SOLD VS. ORIGINAL LIST
98.0%
CLOSING DATE
Jul 11
ADDRESS
1525 SW 12th St.
CLOSED PRICE
$1,200,000
$ / LIVING SQ. FT.
$452
BEDS / BATHS
4 / 4
LIVING SQ. FT.
2,656
LOT SQ. FT.
7,927
DAYS ON MARKET
28
SOLD VS. ORIGINAL LIST
85.7%
CLOSING DATE
Jul 14
ADDRESS
All 105 sales · median
CLOSED PRICE
$900,000
$ / LIVING SQ. FT.
$555
BEDS / BATHS
LIVING SQ. FT.
1,818
LOT SQ. FT.
5,900
DAYS ON MARKET
68
SOLD VS. ORIGINAL LIST
91.3%
CLOSING DATE
Source: Southeast Florida MLS.
How the Month Compared
SHENANDOAH
PRIOR
MONTH
CHANGE
SHENANDOAH
–
PRIOR
–
MONTH
–
CHANGE
–
THE LAST 12 MONTHS
The Last 12 Months in Shenandoah
Chart
Chart
ALL SALES, ROLLING 12 MONTHS
Rolling 12-month figures are calculated from closed MLS sales.
The charts illustrate monthly price fluctuations, while the rolling 12-month figures reflect all qualifying closed sales during the period, providing a broader perspective on Shenandoah’s market.
What 2025 Means for Buyers and Sellers in Shenandoah
SELLERS
For sellers, 2025 rewarded realistic pricing. Homes priced right from the start sold, while those that started high often needed reductions and longer timelines.
BUYERS
For buyers, 2025 offered more choices than any recent year and real room to negotiate, with rates easing toward their lowest levels of the year by December. Prepared buyers could negotiate terms that weren’t possible a few years earlier.
Text
YOUR SHENANDOAH HOME VALUE
Considering Selling a Home in Shenandoah?
Get a personalized valuation informed by current neighborhood sales and firsthand local experience.
Jorge Fernandez | The Shenandoah Guys | SERHANT.
About This Year in Review
This report analyzes single-family home sales and market activity in Shenandoah, Miami, for calendar year 2025, using Southeast Florida MLS data. Jorge Fernandez provides firsthand market analysis and local context to explain the why behind the data and what it means for Shenandoah homeowners, sellers and buyers.
REPORTING PERIOD
January 1 – December 31, 2025
MLS DATA CURRENT AS OF
—
PUBLISHED
—
DATA SOURCE
Southeast Florida MLS
Condominium and townhome sales are not included. Sales referenced may include properties in which Jorge Fernandez/The Shenandoah Guys at SERHANT. Florida LLC did not represent the buyer or seller. Information is provided for market analysis purposes.

REPORT PREPARED BY
Jorge Fernandez, REALTOR®
The Shenandoah Guys | SERHANT. Florida
Professional Recognition & Designations
2026 RealTrends Verified | Top 1.5% Nationwide
Certified Luxury Home Marketing Specialist (CLHMS™) | Million Dollar GUILD™
Master Brokers Forum | Advisory Board
Local Expertise
Miami Native | 21+ Years of Real Estate Experience | 10-Year Shenandoah Resident
Florida Real Estate License #SL3158278
Florida Real Estate License #SL3158278
The Shenandoah Guys | SERHANT. Florida
Miami Native | 21+ Years of Real Estate Experience | 10-Year Shenandoah Resident
← PREVIOUS REPORT
NEXT REPORT →
Report