
YOUR NEIGHBORS IN REAL ESTATE


Hablamos Español


MONTHLY MARKET REPORT
Shenandoah Miami Real Estate Market Update: September 2026
By Jorge Fernandez, REALTOR® · Published October 6, 2026
Market data and analysis from Jorge Fernandez, Shenandoah resident and local real estate market expert, with The Shenandoah Guys at SERHANT.
September brought continued activity to the Shenandoah, Miami housing market: 11 new listings came to market, 7 homes went under contract, and 5 residential sales closed. These closed sales totaled $8.71 million in volume, with a median sale price of $1.35 million.
September 2026 Shenandoah Real Estate at a Glance
Single-family homes · Southeast Florida MLS · Change vs. September 2025
MEDIAN SALE PRICE
$1,350,000
↑ 27% vs. Sept 2025
MEDIAN SOLD $ / SQ. FT.
$606
↑ 10% vs. Sept 2025
MEDIAN DAYS ON MARKET
40
↓ 56% vs. Sept 2025
SOLD AFTER PRICE REDUCTION
20%
↓ 30 pts vs. Sept 2025
MONTHS OF INVENTORY
4.9 months
↓ 1.5 months vs. Sept 2025
Months of inventory estimates how long it would take to sell the homes currently available at the recent pace of sales. We calculate it by dividing active listings at month-end by the average number of monthly closings over the previous 12 months. Lower inventory generally indicates tighter supply; higher inventory indicates more supply relative to demand.
42 active listings ÷ 8.50 average monthly sales = 4.9 months
LABEL
—
—
LABEL
—
—
LABEL
—
—
LABEL
—
—
LABEL
—
—
LABEL
—
—
MARKET ACTIVITY
11
New Listings
7
Homes Went Under Contract
5
Closed Sales
↓ 1 vs. Sept 2025
95.2%
Sold vs. Original List Price
96.8%
Sold vs. Final List Price
Year to date: $78.5 million in Shenandoah single-family sales, January–September 2026, up 2.8% from the same period in 2025.
The Year in Review
Review
The Last 12 Months in Shenandoah
Chart
Chart
Chart
Chart
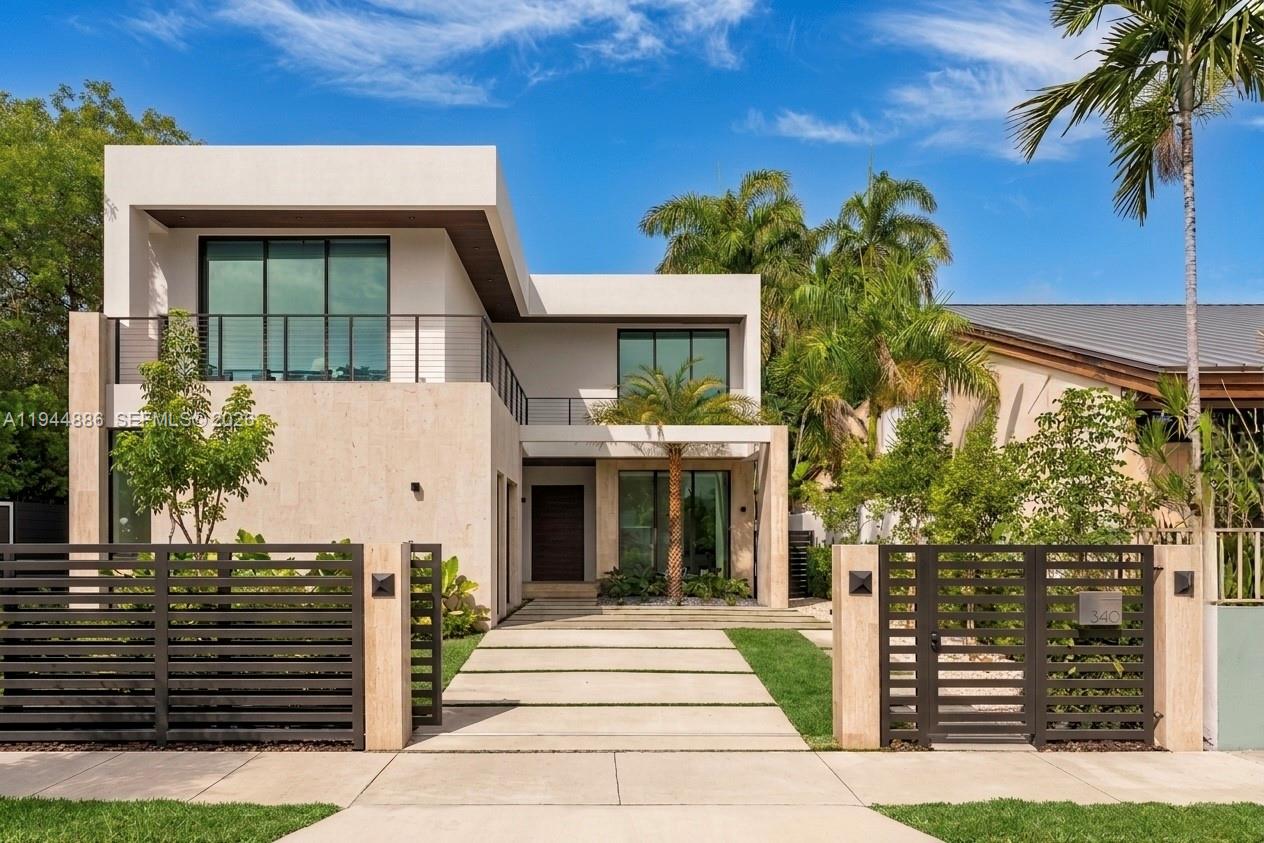
FEATURED SHENANDOAH CLOSING
1344 SW 16th St., Miami
Featured Sale
Details
Bedrooms
5
Bathrooms
5.5
Living Area
4,606 sq. ft.
Lot Size
7,250 sq. ft.
Original List Price
$4,250,000
Sale Price
$4,000,000
Closing Date
September 1, 2026
Data sourced from the Miami MLS for closed sales analysis. This property was listed and sold by other cooperating MLS participant brokerages. SERHANT. Florida and Jorge Fernandez did not represent either party in this transaction and provide this data solely for local real estate market commentary.
Watch Property Video →
A significant milestone for Shenandoah, 1344 SW 16th Street closed for $4 million, the highest recorded sale price for a new-construction home in the neighborhood. Built in 2025, the 5-bedroom, 5.5-bath residence offered 4,606 square feet of living area on a 7,250-square-foot lot and sold for approximately $868 per square foot.
This was not a typical spec home. It was developed by an experienced builder with multiple projects in Shenandoah and a broader track record in high-end and ultra-luxury residential construction throughout Florida. That pedigree, along with the home’s scale, design and finish level, helps explain why it achieved a price point well above more conventional new construction in the neighborhood.
FEATURED SHENANDOAH CLOSING
Featured closing

Sold by Jorge Fernandez
Details
Label
Value
Label
Value
Label
Value
Label
Value
Label
Value
Label
Value
Label
Value
Disclosure
Watch Property Video →
Write-up
FEATURED SHENANDOAH CLOSING
Featured closing
Sold by Jorge Fernandez
Details
Label
Value
Label
Value
Label
Value
Label
Value
Label
Value
Label
Value
Label
Value
Disclosure
Watch Property Video →
Write-up
September 2026 Market Analysis
September’s five closed sales ranged from $730,000 to $4 million, selling from approximately $418 to $868 per square foot (median: $606/sq. ft.), with a median of 40 days on market.
But September also illustrates why neighborhood-wide statistics only tell part of the story. Each of the five sales represented a distinctly different segment of the Shenandoah market: new construction, a substantially reconstructed and expanded home, a charming 1920s Spanish Revival home with a guest house, a development opportunity, and a home requiring extensive renovation.
At the upper end, the $4,000,000 sale at 1344 SW 16th Street set a new benchmark for new construction, while 2434 SW 19th Street, a 1948 home substantially reconstructed and expanded in 2025, sold for $1.8 million, or $723 per square foot. 1233 SW 13th Street sold for $825,000 as a development opportunity, with the value largely in its 7,800-square-foot lot and plans for future development. At the other end, 1828 SW 18th Street, a home requiring extensive renovation, sold for $730,000 after just four days on market, and above its asking price.
That range reinforces an important point when evaluating Shenandoah real estate: price per square foot and neighborhood medians are useful reference points, but they are not substitutes for evaluating an individual property's condition, lot, location, zoning, improvements and overall marketability.
How the Year Compared
SHENANDOAH SINGLE-FAMILY
PRIOR
YEAR
CHANGE
SHENANDOAH SINGLE-FAMILY
–
PRIOR
–
YEAR
–
CHANGE
–
Month by Month
Swipe sideways to see all columns →
MONTH
SALES
MEDIAN PRICE
$ / SQ. FT.
MEDIAN DOM
SOLD VS. ORIG. LIST
MONTH
–
SALES
–
MEDIAN PRICE
–
$ / SQ. FT.
–
MEDIAN DOM
–
SOLD VS. ORIG. LIST
–
Closed Sales by Month
Where Homes Sold: Price Ranges
Existing Homes vs. New Construction
Swipe sideways to see all columns →
HOME TYPE
SALES
MEDIAN PRICE
$ / SQ. FT.
MEDIAN DOM
HOME TYPE
–
SALES
–
MEDIAN PRICE
–
$ / SQ. FT.
–
MEDIAN DOM
–
Every Shenandoah Closed Sale, September 2026
5 single-family sales · highest price first
Swipe sideways to see all columns →
ADDRESS
CLOSED PRICE ▼
$ / LIVING SQ. FT.
BEDS / BATHS
LIVING SQ. FT.
LOT SQ. FT.
DAYS ON MARKET
SOLD VS. ORIGINAL LIST
CLOSING DATE
ADDRESS
1344 SW 16th St. FEATURED
CLOSED PRICE
$4,000,000
$ / LIVING SQ. FT.
$868
BEDS / BATHS
5 / 5.5
LIVING SQ. FT.
4,606
LOT SQ. FT.
7,250
DAYS ON MARKET
40
SOLD VS. ORIGINAL LIST
94.1%
CLOSING DATE
Sept 1
ADDRESS
2434 SW 19th St.
CLOSED PRICE
$1,800,000
$ / LIVING SQ. FT.
$723
BEDS / BATHS
4 / 4
LIVING SQ. FT.
2,488
LOT SQ. FT.
6,667
DAYS ON MARKET
272
SOLD VS. ORIGINAL LIST
95.2%
CLOSING DATE
Sept 24
ADDRESS
1642 SW 12th St.
CLOSED PRICE
$1,350,000
$ / LIVING SQ. FT.
$452
BEDS / BATHS
4 / 3.5
LIVING SQ. FT.
2,984
LOT SQ. FT.
5,900
DAYS ON MARKET
45
SOLD VS. ORIGINAL LIST
93.1%
CLOSING DATE
Sept 18
ADDRESS
1233 SW 13th St.
CLOSED PRICE
$825,000
$ / LIVING SQ. FT.
$606
BEDS / BATHS
2 / 2
LIVING SQ. FT.
1,362
LOT SQ. FT.
DAYS ON MARKET
7
SOLD VS. ORIGINAL LIST
97.1%
CLOSING DATE
Sept 4
ADDRESS
1828 SW 18th St.
CLOSED PRICE
$730,000
$ / LIVING SQ. FT.
$418
BEDS / BATHS
4 / 3
LIVING SQ. FT.
1,746
LOT SQ. FT.
5,450
DAYS ON MARKET
4
SOLD VS. ORIGINAL LIST
100.7%
CLOSING DATE
Sept 22
ADDRESS
Average
CLOSED PRICE
$1,741,000
$ / LIVING SQ. FT.
$614
BEDS / BATHS
LIVING SQ. FT.
2,637
LOT SQ. FT.
6,317
DAYS ON MARKET
74
SOLD VS. ORIGINAL LIST
96.0%
CLOSING DATE
ADDRESS
Median
CLOSED PRICE
$1,350,000
$ / LIVING SQ. FT.
$606
BEDS / BATHS
LIVING SQ. FT.
2,488
LOT SQ. FT.
6,284
DAYS ON MARKET
40
SOLD VS. ORIGINAL LIST
95.2%
CLOSING DATE
Source: Southeast Florida MLS.
How September Compared With August
SHENANDOAH
AUG 2026
SEPT 2026
CHANGE
SHENANDOAH
New listings
AUG 2026
9
SEPT 2026
11
CHANGE
↑ 2
SHENANDOAH
Under contract
AUG 2026
7
SEPT 2026
7
CHANGE
→ 0
SHENANDOAH
Closed sales
AUG 2026
6
SEPT 2026
5
CHANGE
↓ 1
SHENANDOAH
Closed volume
AUG 2026
$7.21M
SEPT 2026
$8.71M
CHANGE
↑ 20.7%
SHENANDOAH
Median sale price
AUG 2026
$930,000
SEPT 2026
$1,350,000
CHANGE
↑ 45.2%
SHENANDOAH
Median $ / sq. ft.
AUG 2026
$497
SEPT 2026
$606
CHANGE
↑ 21.9%
SHENANDOAH
Median days on market
AUG 2026
43
SEPT 2026
40
CHANGE
↓ 3 days
SHENANDOAH
Months of inventory
AUG 2026
4.9
SEPT 2026
4.9
CHANGE
→ 0 months
THE LAST 12 MONTHS
The Last 12 Months: A Broader View of Shenandoah’s Market
October 2025 – September 2026 · Single-family homes
Median Sale Price
Monthly median
Median Price per Sq. Ft.
Monthly median
ALL SALES, ROLLING 12 MONTHS
Over the 12 months ending September 2026, 102 Shenandoah single-family homes sold, with a median sale price of $881,500. The median sale price per square foot was $536, and homes spent a median of 56 days on the market.
The charts illustrate monthly price fluctuations, while the rolling 12-month figures reflect all qualifying closed sales during the period, providing a broader perspective on Shenandoah’s market.
What This Means If You're Buying or Selling in Shenandoah
SELLERS
For sellers, September shows how strongly buyers are differentiating between property types. New construction and highly renovated homes are commanding a premium, while homes requiring work are being valued very differently.
BUYERS
For buyers, I’m seeing increased demand, particularly from people relocating to Miami, for homes that are new, renovated and move-in ready. Many are willing to pay more for that convenience while still wanting a central location, which continues to support demand for Shenandoah.
That makes accurate pricing especially important: the right comparable sale depends on the home, not simply the neighborhood average.
Text
YOUR SHENANDOAH HOME VALUE
Considering Selling a Home in Shenandoah?
September's sales demonstrate how dramatically pricing can vary based on a home's condition, improvements, and market positioning. Get a personalized valuation informed by current neighborhood sales and firsthand local experience.
Jorge Fernandez | The Shenandoah Guys | SERHANT.
About This Monthly Market Report
This report analyzes single-family home sales and market activity in Shenandoah, Miami, using Southeast Florida MLS data for the reporting period. Rather than simply reporting the numbers, Jorge Fernandez provides firsthand market analysis and local context to explain the why behind the data, what is driving current market activity, and what it may mean for Shenandoah homeowners, sellers and buyers. Insights are informed by current MLS activity along with firsthand experience listing, marketing, showing and selling homes throughout the neighborhood.
Months of inventory is calculated using active Shenandoah single-family listings at month-end divided by the average monthly closed sales over the trailing 12 months.
REPORTING PERIOD
September 1–30, 2026
MLS DATA CURRENT AS OF
October 6, 2026
PUBLISHED
October 6, 2026
DATA SOURCE
Southeast Florida MLS
Condominium and townhome sales are not included. Sales referenced may include properties in which Jorge Fernandez/The Shenandoah Guys at SERHANT. Florida LLC did not represent the buyer or seller. Information is provided for market analysis purposes.

REPORT PREPARED BY
Jorge Fernandez, REALTOR®
The Shenandoah Guys | SERHANT. Florida
Professional Recognition & Designations
2026 RealTrends Verified | Top 1.5% Nationwide
Certified Luxury Home Marketing Specialist (CLHMS™) | Million Dollar GUILD™
Master Brokers Forum | Advisory Board
Local Expertise
Miami Native | 21+ Years of Real Estate Experience | 10-Year Shenandoah Resident
Florida Real Estate License #SL3158278
Florida Real Estate License #SL3158278
The Shenandoah Guys | SERHANT. Florida
Miami Native | 21+ Years of Real Estate Experience | 10-Year Shenandoah Resident
← PREVIOUS REPORT
NEXT REPORT →
Report