
YOUR NEIGHBORS IN REAL ESTATE


Hablamos Español


MONTHLY MARKET REPORT
Shenandoah Miami Real Estate Market Update: October 2025
By Jorge Fernandez, REALTOR®
Market data and analysis from Jorge Fernandez, Shenandoah resident and local real estate market expert, with The Shenandoah Guys at SERHANT.
In October 2025, the Shenandoah, Miami single-family market recorded 14 new listings, 8 homes going under contract and 16 closed sales, with a median sale price of $930,000 and a median of $540 per square foot.
October 2025 Shenandoah Real Estate at a Glance
Single-family homes · Southeast Florida MLS · Change vs. October 2024
MEDIAN SALE PRICE
$930,000
↑ 16% vs. Oct 2024
MEDIAN SOLD $ / SQ. FT.
$540
↑ 1% vs. Oct 2024
MEDIAN DAYS ON MARKET
111
↑ 484% vs. Oct 2024
SOLD AFTER PRICE REDUCTION
50%
↑ 25 pts vs. Oct 2024
MONTHS OF INVENTORY
6.1 months
↑ 1.7 months vs. Oct 2024
Months of inventory estimates how long it would take to sell the homes currently available at the recent pace of sales. We calculate it by dividing active listings at month-end by the average number of monthly closings over the previous 12 months. Lower inventory generally indicates tighter supply; higher inventory indicates more supply relative to demand.
55 active listings ÷ 9.00 average monthly sales = 6.1 months
LABEL
—
—
LABEL
—
—
LABEL
—
—
LABEL
—
—
LABEL
—
—
LABEL
—
—
MARKET ACTIVITY
14
New Listings
↑ 4 vs. Oct 2024
8
Homes Went Under Contract
→ 0 vs. Oct 2024
16
Closed Sales
↑ 8 vs. Oct 2024
91.1%
Sold vs. Original List Price
95.2%
Sold vs. Final List Price
Year to date: $94.0 million in Shenandoah single-family sales, January–October 2025, up 7.6% from the same period in 2024.
The Year in Review
Review
The Last 12 Months in Shenandoah
Chart
Chart
Chart
Chart
FEATURED SHENANDOAH CLOSING
2305 SW 19th Terrace, Miami
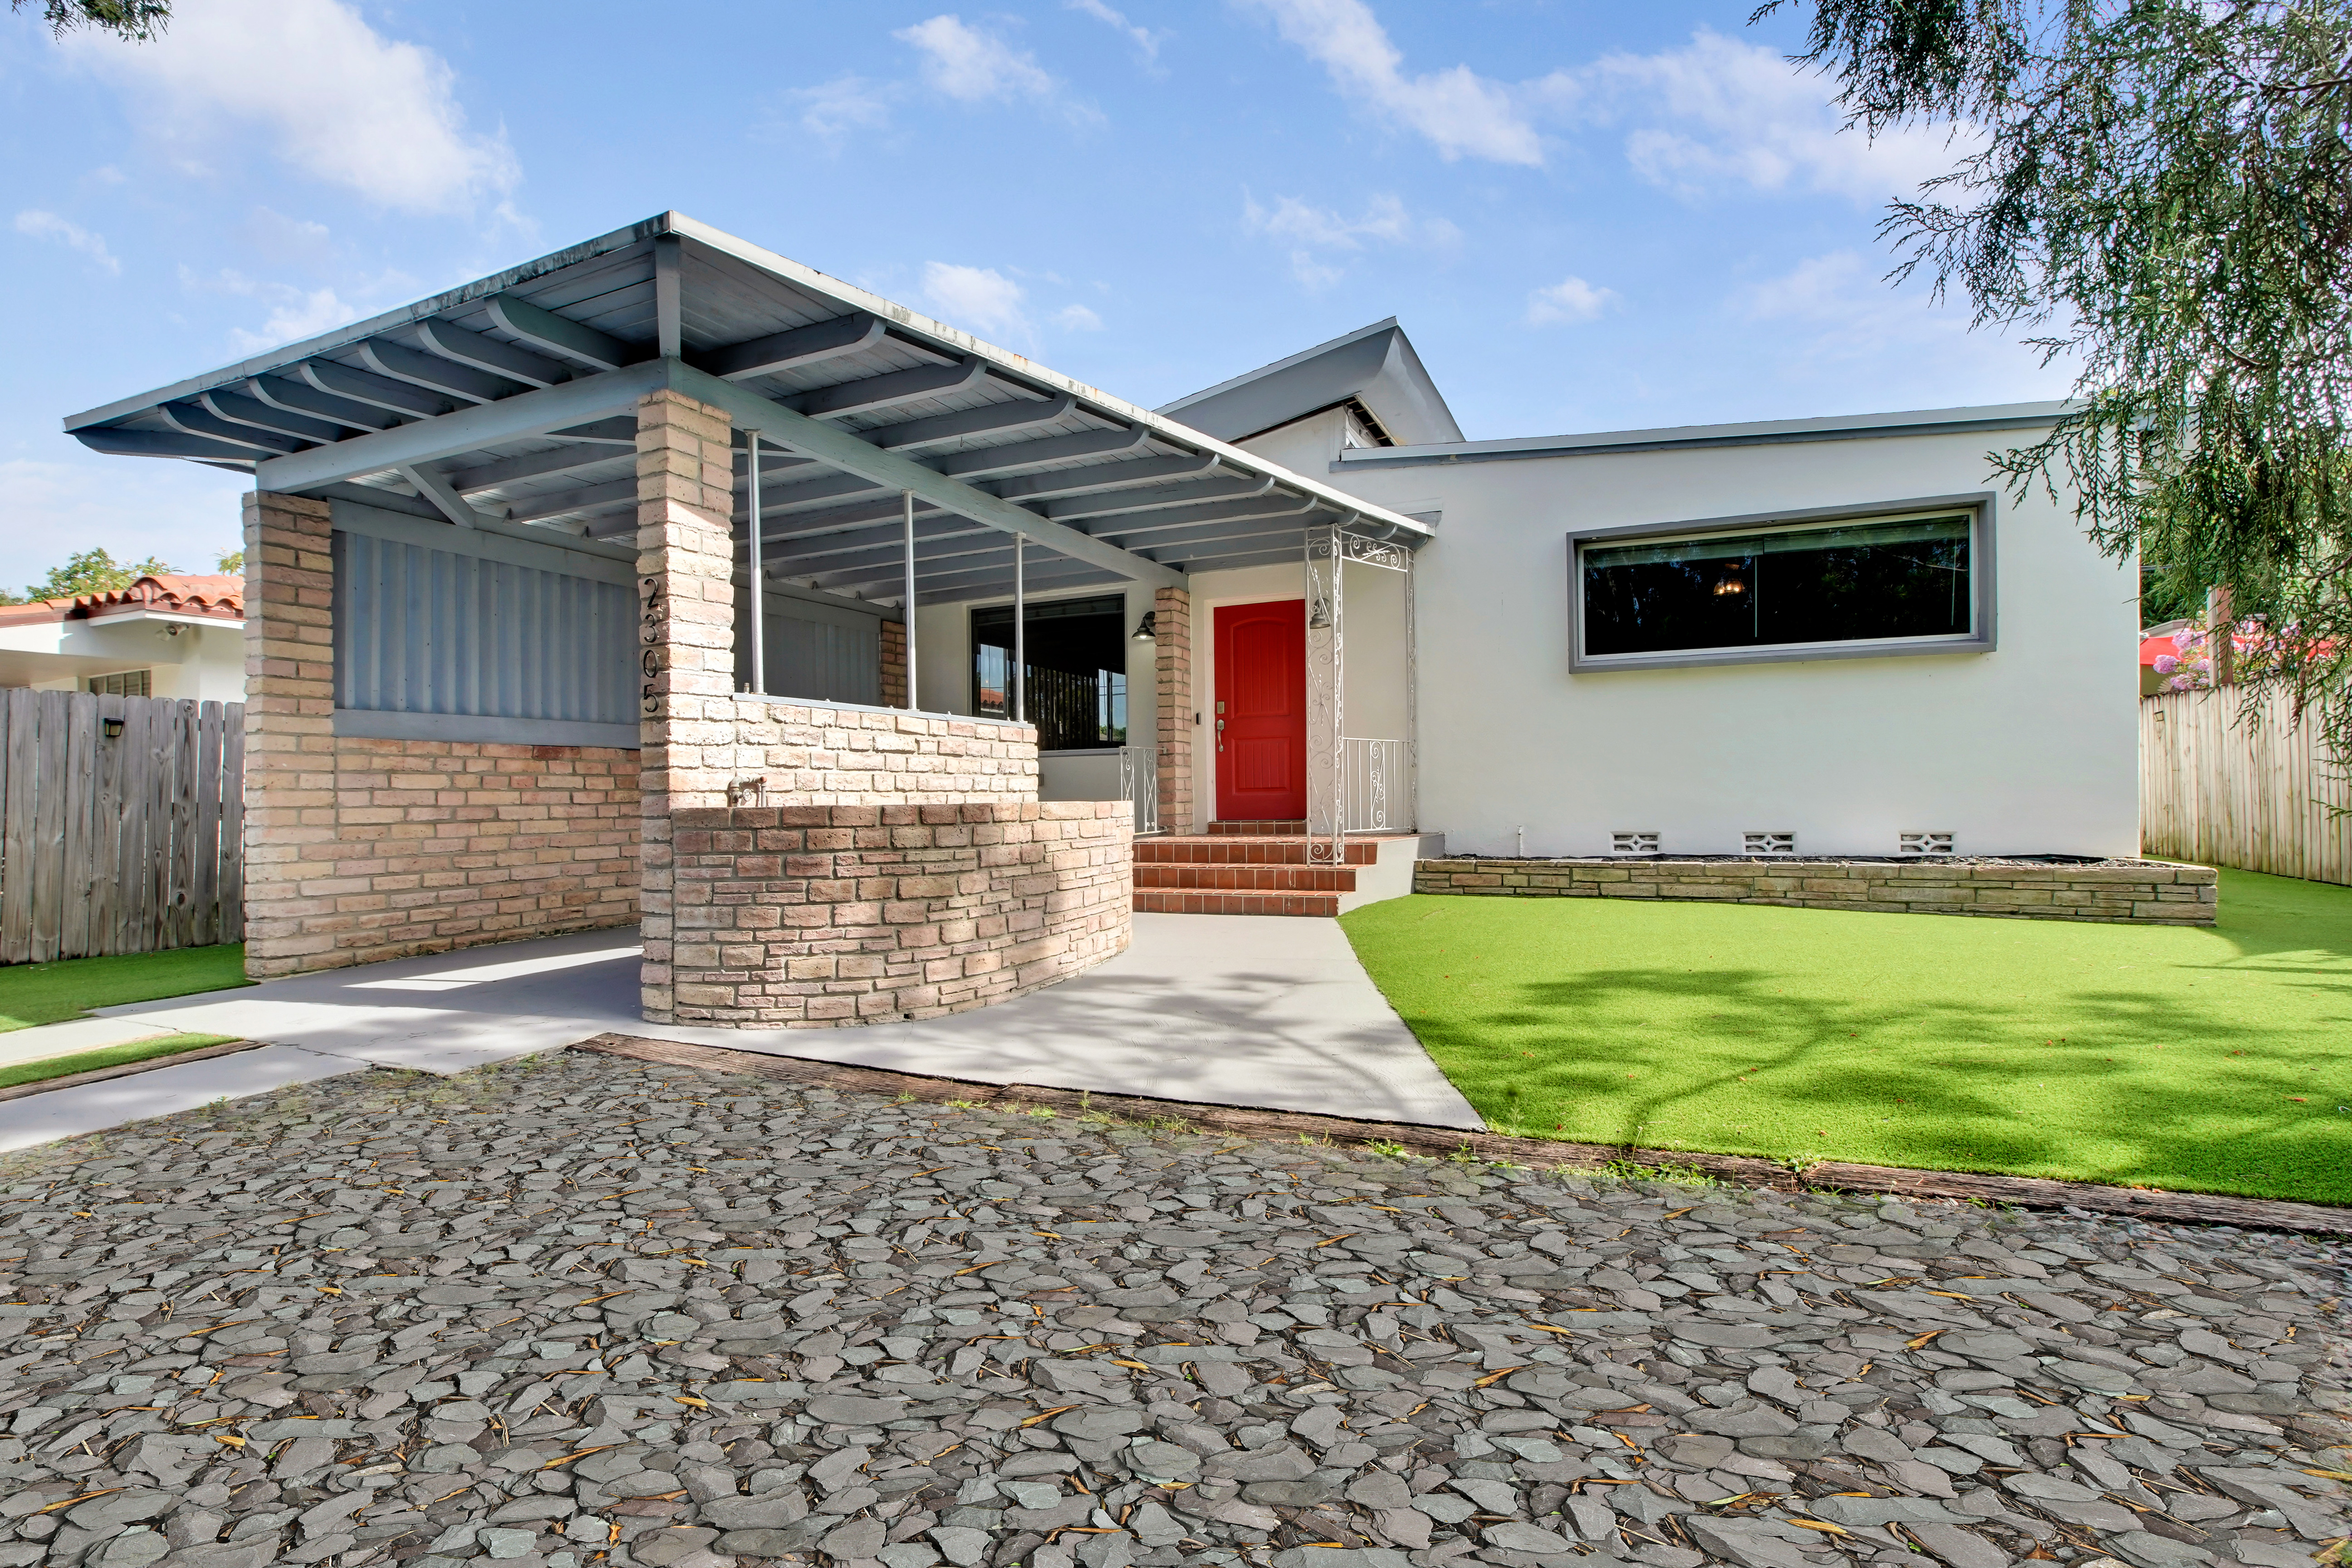
Sold | Listed by Jorge Fernandez
The Shenandoah Guys
Details
Bedrooms
2
Bathrooms
2
Living Area
1,331 sq. ft.
Lot Size
5,500 sq. ft.
Original List Price
$969,000
Sale Price
$910,000
Closing Date
October 10, 2025
Disclosure
Write-up
FEATURED SHENANDOAH CLOSING
Featured closing

Sold by Jorge Fernandez
Details
Label
Value
Label
Value
Label
Value
Label
Value
Label
Value
Label
Value
Label
Value
Disclosure
Watch Property Video →
Write-up
FEATURED SHENANDOAH CLOSING
Featured closing
Sold by Jorge Fernandez
Details
Label
Value
Label
Value
Label
Value
Label
Value
Label
Value
Label
Value
Label
Value
Disclosure
Watch Property Video →
Write-up
Market Snapshot
Snapshot
How the Year Compared
SHENANDOAH SINGLE-FAMILY
PRIOR
YEAR
CHANGE
SHENANDOAH SINGLE-FAMILY
–
PRIOR
–
YEAR
–
CHANGE
–
Month by Month
Swipe sideways to see all columns →
MONTH
SALES
MEDIAN PRICE
$ / SQ. FT.
MEDIAN DOM
SOLD VS. ORIG. LIST
MONTH
–
SALES
–
MEDIAN PRICE
–
$ / SQ. FT.
–
MEDIAN DOM
–
SOLD VS. ORIG. LIST
–
Closed Sales by Month
Where Homes Sold: Price Ranges
Existing Homes vs. New Construction
Swipe sideways to see all columns →
HOME TYPE
SALES
MEDIAN PRICE
$ / SQ. FT.
MEDIAN DOM
HOME TYPE
–
SALES
–
MEDIAN PRICE
–
$ / SQ. FT.
–
MEDIAN DOM
–
Every Shenandoah Closed Sale, October 2025
16 single-family sales · highest price first
Swipe sideways to see all columns →
ADDRESS
CLOSED PRICE ▼
$ / LIVING SQ. FT.
BEDS / BATHS
LIVING SQ. FT.
LOT SQ. FT.
DAYS ON MARKET
SOLD VS. ORIGINAL LIST
CLOSING DATE
ADDRESS
1375 SW 17th Ter.
CLOSED PRICE
$2,280,000
$ / LIVING SQ. FT.
$672
BEDS / BATHS
4 / 4.5
LIVING SQ. FT.
3,395
LOT SQ. FT.
13,680
DAYS ON MARKET
502
SOLD VS. ORIGINAL LIST
79.3%
CLOSING DATE
Oct 22
ADDRESS
1801 SW 12th St.
CLOSED PRICE
$1,900,000
$ / LIVING SQ. FT.
$552
BEDS / BATHS
5 / 3.5
LIVING SQ. FT.
3,444
LOT SQ. FT.
12,626
DAYS ON MARKET
133
SOLD VS. ORIGINAL LIST
69.1%
CLOSING DATE
Oct 30
ADDRESS
1860 SW 12th St.
CLOSED PRICE
$1,800,000
$ / LIVING SQ. FT.
$668
BEDS / BATHS
4 / 3.5
LIVING SQ. FT.
2,695
LOT SQ. FT.
8,850
DAYS ON MARKET
51
SOLD VS. ORIGINAL LIST
100.0%
CLOSING DATE
Oct 3
ADDRESS
1145 SW 20th Ave.
CLOSED PRICE
$1,360,100
$ / LIVING SQ. FT.
$582
BEDS / BATHS
5 / 3.5
LIVING SQ. FT.
2,336
LOT SQ. FT.
7,100
DAYS ON MARKET
221
SOLD VS. ORIGINAL LIST
83.7%
CLOSING DATE
Oct 15
ADDRESS
1525 SW 18th St.
CLOSED PRICE
$1,040,000
$ / LIVING SQ. FT.
$545
BEDS / BATHS
3 / 2
LIVING SQ. FT.
1,907
LOT SQ. FT.
8,580
DAYS ON MARKET
113
SOLD VS. ORIGINAL LIST
81.6%
CLOSING DATE
Oct 13
ADDRESS
1724 SW 10th St.
CLOSED PRICE
$1,033,888
$ / LIVING SQ. FT.
$442
BEDS / BATHS
4 / 3
LIVING SQ. FT.
2,340
LOT SQ. FT.
5,900
DAYS ON MARKET
131
SOLD VS. ORIGINAL LIST
94.1%
CLOSING DATE
Oct 8
ADDRESS
1884 SW 16th St.
CLOSED PRICE
$980,000
$ / LIVING SQ. FT.
$533
BEDS / BATHS
4 / 3
LIVING SQ. FT.
1,839
LOT SQ. FT.
5,450
DAYS ON MARKET
209
SOLD VS. ORIGINAL LIST
89.2%
CLOSING DATE
Oct 8
ADDRESS
1508 SW 15th St.
CLOSED PRICE
$950,000
$ / LIVING SQ. FT.
$536
BEDS / BATHS
2 / 2
LIVING SQ. FT.
1,774
LOT SQ. FT.
5,450
DAYS ON MARKET
109
SOLD VS. ORIGINAL LIST
65.1%
CLOSING DATE
Oct 30
ADDRESS
2305 SW 19th Ter. FEATURED SOLD BY JORGE ▶︎ Video
CLOSED PRICE
$910,000
$ / LIVING SQ. FT.
$684
BEDS / BATHS
2 / 2
LIVING SQ. FT.
1,331
LOT SQ. FT.
5,500
DAYS ON MARKET
88
SOLD VS. ORIGINAL LIST
93.9%
CLOSING DATE
Oct 10
ADDRESS
1711 SW 18th St.
CLOSED PRICE
$880,000
$ / LIVING SQ. FT.
$854
BEDS / BATHS
2 / 1
LIVING SQ. FT.
1,031
LOT SQ. FT.
7,646
DAYS ON MARKET
21
SOLD VS. ORIGINAL LIST
103.5%
CLOSING DATE
Oct 27
ADDRESS
2168 SW 12th St.
CLOSED PRICE
$870,000
$ / LIVING SQ. FT.
$372
BEDS / BATHS
3 / 2
LIVING SQ. FT.
2,338
LOT SQ. FT.
7,250
DAYS ON MARKET
0
SOLD VS. ORIGINAL LIST
CLOSING DATE
Oct 10
ADDRESS
2121 SW 20th.
CLOSED PRICE
$850,000
$ / LIVING SQ. FT.
$663
BEDS / BATHS
2 / 2
LIVING SQ. FT.
1,282
LOT SQ. FT.
6,000
DAYS ON MARKET
66
SOLD VS. ORIGINAL LIST
96.9%
CLOSING DATE
Oct 20
ADDRESS
2190 SW 16th St.
CLOSED PRICE
$849,000
$ / LIVING SQ. FT.
$419
BEDS / BATHS
3 / 3
LIVING SQ. FT.
2,025
LOT SQ. FT.
5,683
DAYS ON MARKET
18
SOLD VS. ORIGINAL LIST
100.0%
CLOSING DATE
Oct 3
ADDRESS
1959 SW 12th St.
CLOSED PRICE
$820,000
$ / LIVING SQ. FT.
$465
BEDS / BATHS
4 / 3
LIVING SQ. FT.
1,762
LOT SQ. FT.
6,030
DAYS ON MARKET
232
SOLD VS. ORIGINAL LIST
91.1%
CLOSING DATE
Oct 2
ADDRESS
2283 SW 17th St.
CLOSED PRICE
$567,000
$ / LIVING SQ. FT.
$397
BEDS / BATHS
2 / 1
LIVING SQ. FT.
1,428
LOT SQ. FT.
5,450
DAYS ON MARKET
7
SOLD VS. ORIGINAL LIST
103.1%
CLOSING DATE
Oct 15
ADDRESS
2363 SW 11th Ter.
CLOSED PRICE
$560,000
$ / LIVING SQ. FT.
$393
BEDS / BATHS
4 / 2
LIVING SQ. FT.
1,426
LOT SQ. FT.
5,850
DAYS ON MARKET
238
SOLD VS. ORIGINAL LIST
80.0%
CLOSING DATE
Oct 20
ADDRESS
Average
CLOSED PRICE
$1,103,124
$ / LIVING SQ. FT.
$548
BEDS / BATHS
LIVING SQ. FT.
2,022
LOT SQ. FT.
7,315
DAYS ON MARKET
134
SOLD VS. ORIGINAL LIST
88.7%
CLOSING DATE
ADDRESS
Median
CLOSED PRICE
$930,000
$ / LIVING SQ. FT.
$540
BEDS / BATHS
LIVING SQ. FT.
1,873
LOT SQ. FT.
6,015
DAYS ON MARKET
111
SOLD VS. ORIGINAL LIST
91.1%
CLOSING DATE
Source: Southeast Florida MLS.
How October Compared With September
SHENANDOAH
SEPT 2025
OCT 2025
CHANGE
SHENANDOAH
New listings
SEPT 2025
11
OCT 2025
14
CHANGE
↑ 3
SHENANDOAH
Under contract
SEPT 2025
14
OCT 2025
8
CHANGE
↓ 6
SHENANDOAH
Closed sales
SEPT 2025
6
OCT 2025
16
CHANGE
↑ 10
SHENANDOAH
Closed volume
SEPT 2025
$6.19M
OCT 2025
$17.65M
CHANGE
↑ 185.1%
SHENANDOAH
Median sale price
SEPT 2025
$1,060,000
OCT 2025
$930,000
CHANGE
↓ 12.3%
SHENANDOAH
Median $ / sq. ft.
SEPT 2025
$552
OCT 2025
$540
CHANGE
↓ 2.1%
SHENANDOAH
Median days on market
SEPT 2025
90
OCT 2025
111
CHANGE
↑ 21 days
SHENANDOAH
Months of inventory
SEPT 2025
6.5
OCT 2025
6.1
CHANGE
↓ 0.4 months
THE LAST 12 MONTHS
The Last 12 Months: A Broader View of Shenandoah’s Market
November 2024 – October 2025 · Single-family homes
Median Sale Price
Monthly median
Median Price per Sq. Ft.
Monthly median
ALL SALES, ROLLING 12 MONTHS
Over the 12 months ending October 2025, 108 Shenandoah single-family homes sold, with a median sale price of $900,000. The median sale price per square foot was $548, and homes spent a median of 70 days on the market.
The charts illustrate monthly price fluctuations, while the rolling 12-month figures reflect all qualifying closed sales during the period, providing a broader perspective on Shenandoah’s market.
What This Means If You're Buying or Selling in Shenandoah
SELLERS
Text
BUYERS
Text
Text
YOUR SHENANDOAH HOME VALUE
Considering Selling a Home in Shenandoah?
Get a personalized valuation informed by current neighborhood sales and firsthand local experience.
Jorge Fernandez | The Shenandoah Guys | SERHANT.
About This Monthly Market Report
This report analyzes single-family home sales and market activity in Shenandoah, Miami, using Southeast Florida MLS data for the reporting period. Rather than simply reporting the numbers, Jorge Fernandez provides firsthand market analysis and local context to explain the why behind the data, what is driving current market activity, and what it may mean for Shenandoah homeowners, sellers and buyers. Insights are informed by current MLS activity along with firsthand experience listing, marketing, showing and selling homes throughout the neighborhood.
Months of inventory is calculated using active Shenandoah single-family listings at month-end divided by the average monthly closed sales over the trailing 12 months.
REPORTING PERIOD
October 1–31, 2025
MLS DATA CURRENT AS OF
—
PUBLISHED
—
DATA SOURCE
Southeast Florida MLS
Condominium and townhome sales are not included. Sales referenced may include properties in which Jorge Fernandez/The Shenandoah Guys at SERHANT. Florida LLC did not represent the buyer or seller. Information is provided for market analysis purposes.

REPORT PREPARED BY
Jorge Fernandez, REALTOR®
The Shenandoah Guys | SERHANT. Florida
Professional Recognition & Designations
2026 RealTrends Verified | Top 1.5% Nationwide
Certified Luxury Home Marketing Specialist (CLHMS™) | Million Dollar GUILD™
Master Brokers Forum | Advisory Board
Local Expertise
Miami Native | 21+ Years of Real Estate Experience | 10-Year Shenandoah Resident
Florida Real Estate License #SL3158278
Florida Real Estate License #SL3158278
The Shenandoah Guys | SERHANT. Florida
Miami Native | 21+ Years of Real Estate Experience | 10-Year Shenandoah Resident
← PREVIOUS REPORT
NEXT REPORT →