
YOUR NEIGHBORS IN REAL ESTATE


Hablamos Español


YEAR IN REVIEW
Shenandoah Miami Real Estate: 2018 Year in Review
By Jorge Fernandez, REALTOR®
Market data and analysis from Jorge Fernandez, Shenandoah resident and local real estate market expert, with The Shenandoah Guys at SERHANT.
A full-year look at Shenandoah single-family sales in 2018: prices, pace, negotiating power and how our neighborhood’s market changed compared with 2017.
2018 Shenandoah Real Estate at a Glance
Single-family homes · Southeast Florida MLS · Change vs. 2017
LABEL
—
—
LABEL
—
—
LABEL
—
—
LABEL
—
—
LABEL
—
—
Months of inventory
Calculation
MEDIAN SALE PRICE
$435,000
↑ 6.1% vs. 2017
MEDIAN SOLD $ / SQ. FT.
$263
↑ 11.9% vs. 2017
CLOSED SALES
109
↑ 5 vs. 2017
TOTAL SALES VOLUME
$49.5M
↑ 9.8% vs. 2017
SOLD VS. ORIGINAL LIST PRICE
93.1%
↑ 0.1 pts vs. 2017
MEDIAN DAYS ON MARKET
64
↓ 8 days vs. 2017
MARKET ACTIVITY
162
Homes Listed for Sale
↓ 5 vs. 2017
96.1%
Sold vs. Final List Price
↑ 1.0 pts vs. 2017
39%
Sold After Price Reduction
↑ 1 pt vs. 2017
—
Label
—
Label
Year to date
The 2018 Shenandoah Market in Review
Shenandoah’s price per square foot jumped nearly 12% in 2018, the strongest gain of the year among our neighborhood’s key measures. 109 single-family homes closed, up from 104 in 2017, and total sales volume rose 9.8% to $49.5 million. The median sale price rose 6.1% to $435,000, and the median price per square foot climbed 11.9% to $263.
Rising borrowing costs were the year’s headwind. The Federal Reserve raised its benchmark rate four times, and thirty-year mortgage rates climbed from about 4% in January to nearly 5% by November, their highest level in seven years. At the same time, the new federal tax law capped deductions for state and local taxes, giving many high earners in the Northeast a fresh reason to look at Florida. Buyers who came to Miami were increasingly drawn to central neighborhoods like ours, with older homes on generous lots close to Coral Gables, Brickell and Downtown.
For buyers, there was still room to negotiate. The median home took 64 days to sell, about a week faster than in 2017. Only 18% of sales closed at or above asking, and 39% needed a price reduction. The typical home sold at 93.1% of its original list price. Inventory tightened, though: roughly 5.7 months of supply, down from about 7.4 in 2017, as more of the homes that came to market found buyers.
The highest sale of the year was 2030 SW 12th Avenue, a 1938 home that sold in June for $830,000, followed by 1724 SW 22nd Avenue at $752,000. Only two homes sold for $750,000 or more, and most sales were well under $500,000. Featured below are two homes I represented in 2018: 1890 SW 13th Street, where I represented the buyers in an April purchase at $480,000, and 1860 SW 11th Street, which sold in December for $530,000.
Shenandoah Since 2016: The Long-Term Trend
2016 – 2018 · single-family homes · one point per year
Median Sale Price
Full-year median, 2016–2018
Median Price per Sq. Ft.
Full-year median, 2016–2018
Closed Sales per Year
Single-family homes
Sold vs. Original List Price
Median, as a percent of original asking price
FEATURED 2018 CLOSINGS
1890 SW 13th Street, Miami
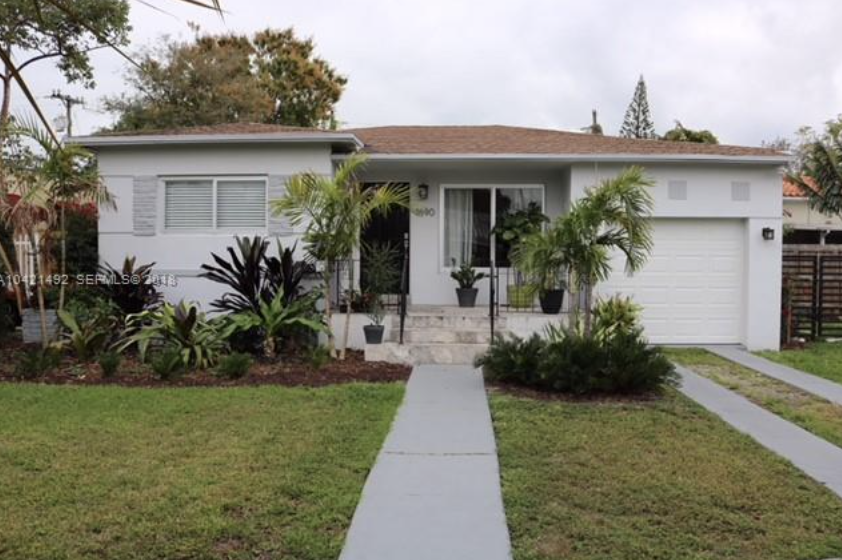
Sold by Jorge Fernandez
The Shenandoah Guys
Details
Bedrooms
3
Bathrooms
2
Living Area
1,253 sq. ft.
Lot Size
4,994 sq. ft.
Original List Price
$489,000
Sale Price
$480,000
Closing Date
April 9, 2018
Disclosure
Watch Property Video →
Write-up
FEATURED SHENANDOAH CLOSING
1860 SW 11th Street, Miami
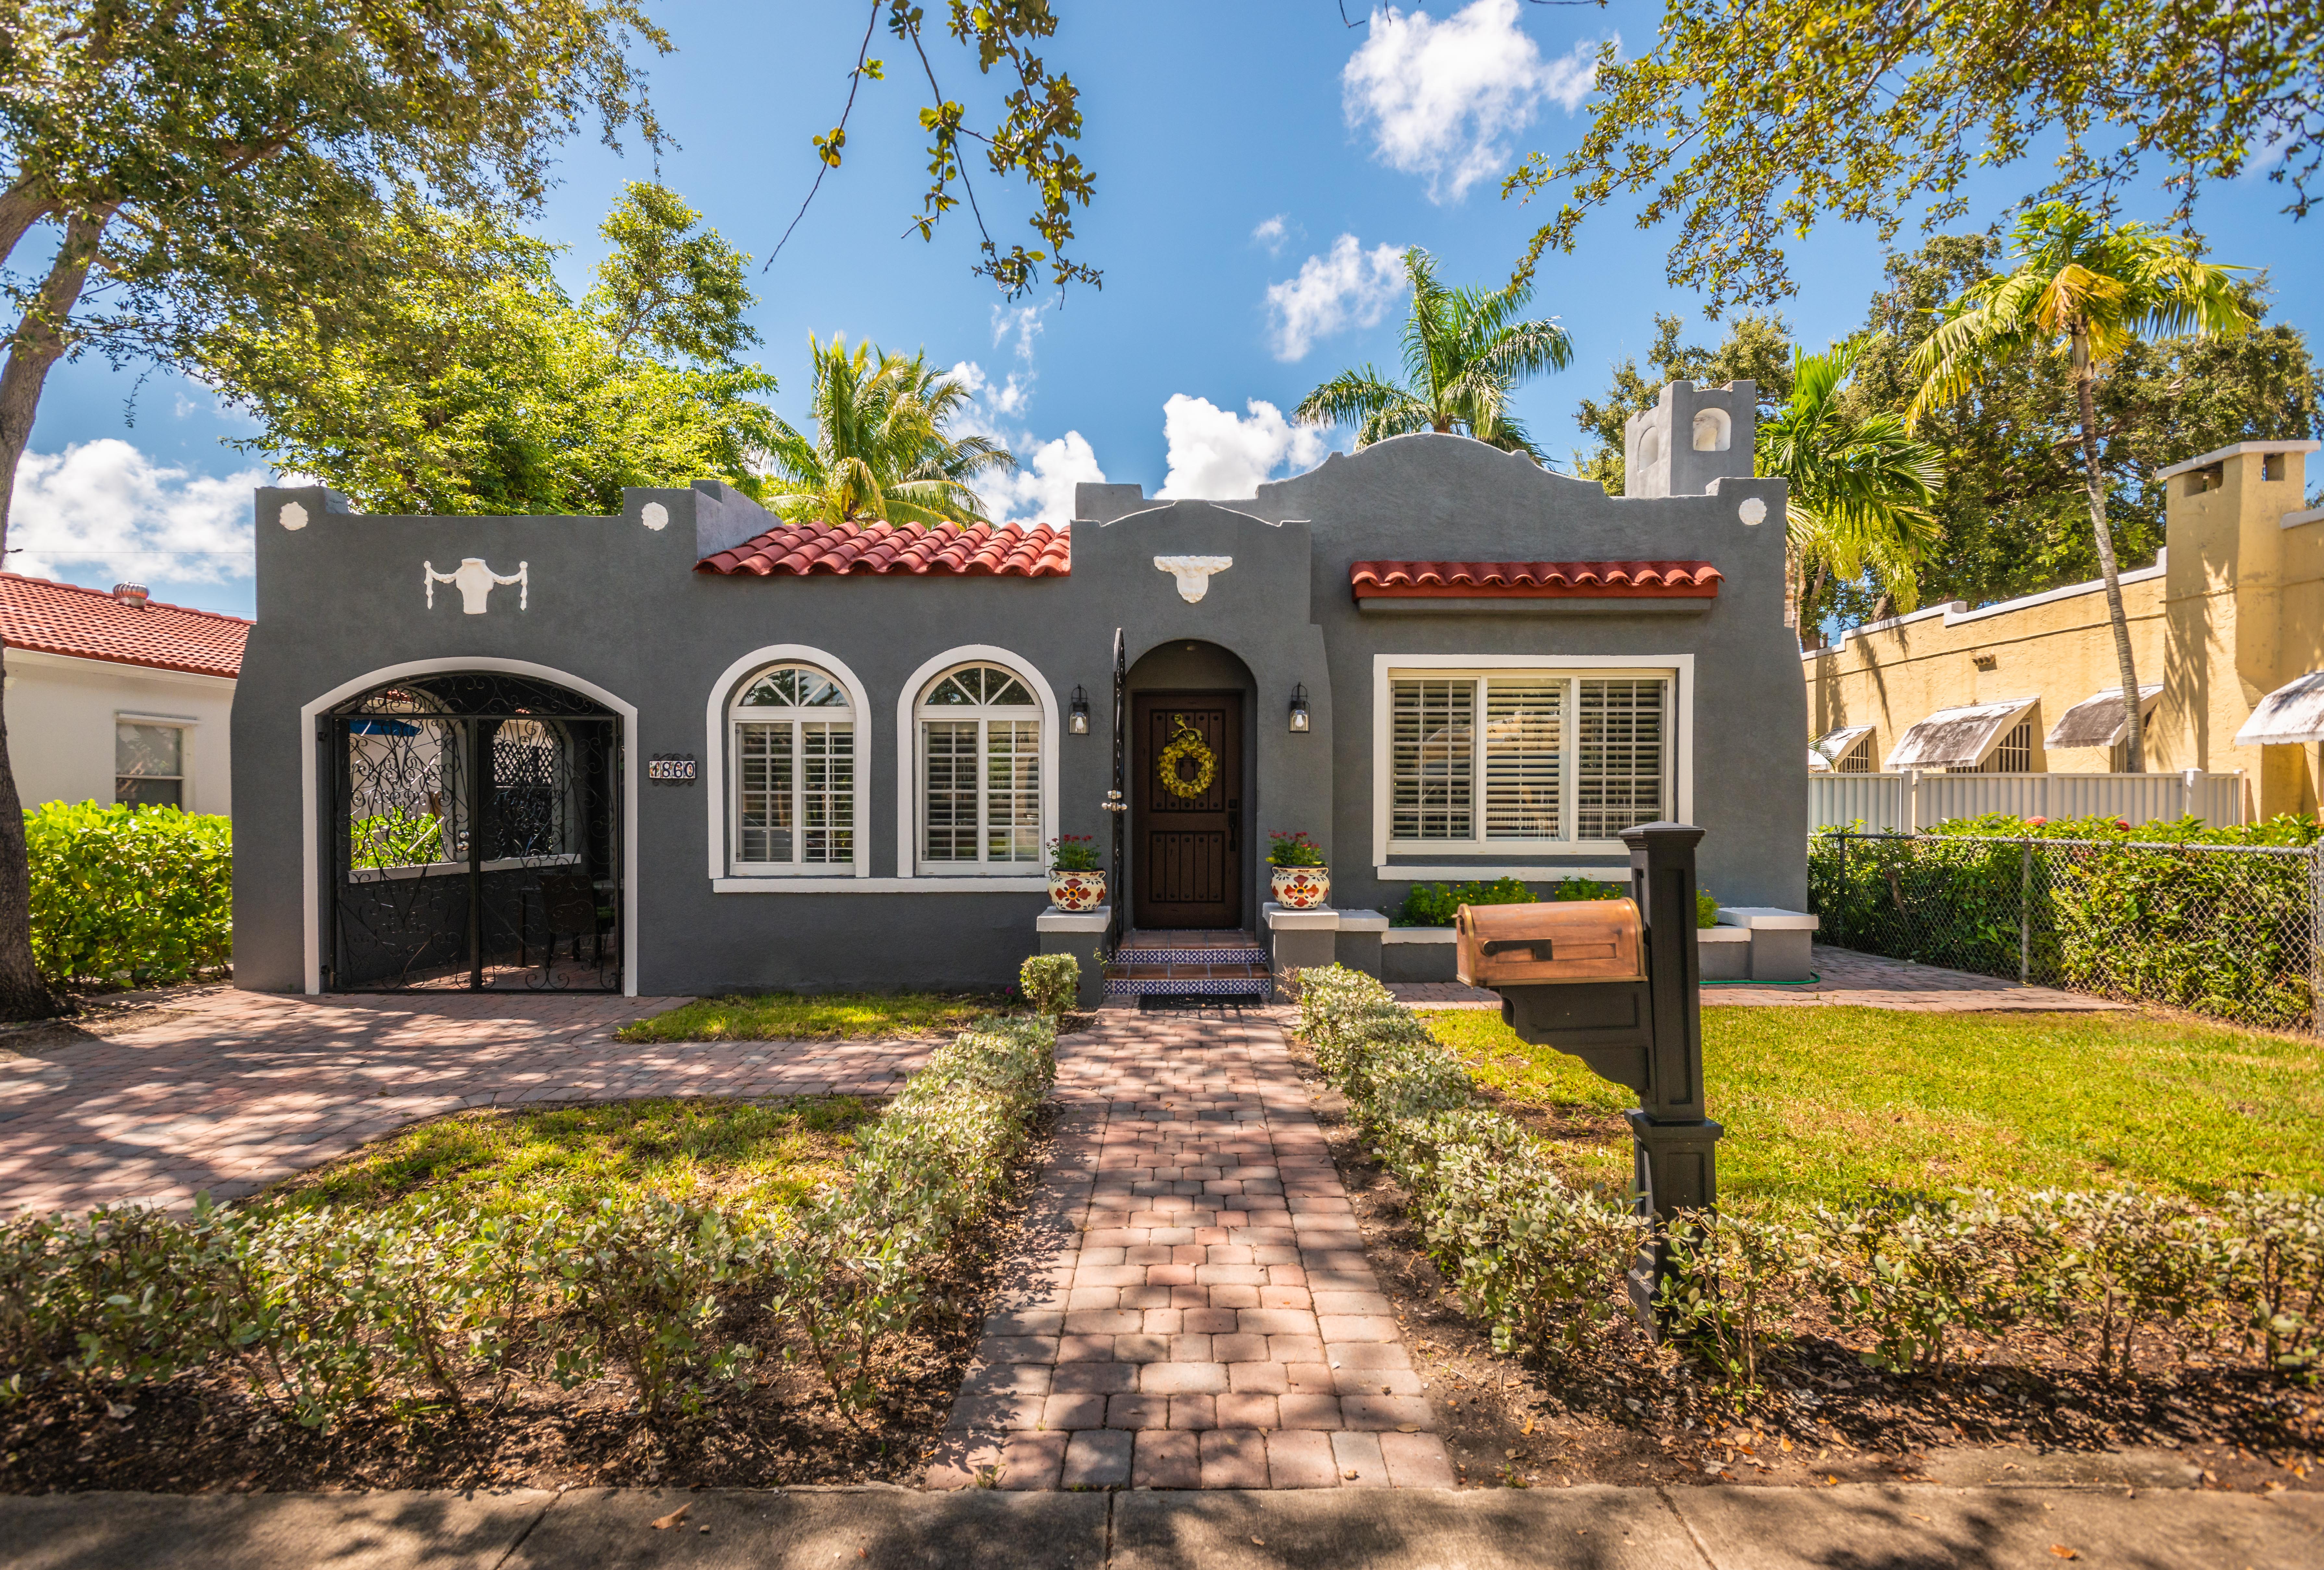
Sold | Listed by Jorge Fernandez
The Shenandoah Guys
Details
Bedrooms
4
Bathrooms
2
Living Area
1,900 sq. ft.
Lot Size
5,900 sq. ft.
Original List Price
$549,000
Sale Price
$530,000
Closing Date
December 27, 2018
Disclosure
Watch Property Video →
Write-up
FEATURED SHENANDOAH CLOSING
Featured closing

Sold by Jorge Fernandez
Details
Label
Value
Label
Value
Label
Value
Label
Value
Label
Value
Label
Value
Label
Value
Disclosure
Watch Property Video →
Write-up
Market Snapshot
Snapshot
How 2018 Compared With 2017
Shenandoah single-family homes
SHENANDOAH SINGLE-FAMILY
2017
2018
CHANGE
SHENANDOAH SINGLE-FAMILY
Closed sales
2017
104
2018
109
CHANGE
↑ 5%
SHENANDOAH SINGLE-FAMILY
Total sales volume
2017
$45.1M
2018
$49.5M
CHANGE
↑ 9.8%
SHENANDOAH SINGLE-FAMILY
Median sold price
2017
$410,000
2018
$435,000
CHANGE
↑ 6.1%
SHENANDOAH SINGLE-FAMILY
Median original asking price
2017
$437,450
2018
$475,000
CHANGE
↑ 8.6%
SHENANDOAH SINGLE-FAMILY
Median price / sq. ft.
2017
$235
2018
$263
CHANGE
↑ 11.9%
SHENANDOAH SINGLE-FAMILY
Sold vs. original list price
2017
93.0%
2018
93.1%
CHANGE
↑ 0.1 pts
SHENANDOAH SINGLE-FAMILY
Sold vs. final list price
2017
95.1%
2018
96.1%
CHANGE
↑ 1.0 pts
SHENANDOAH SINGLE-FAMILY
Median days on market
2017
72
2018
64
CHANGE
↓ 8 days
SHENANDOAH SINGLE-FAMILY
Sales after a price reduction
2017
38%
2018
39%
CHANGE
↑ 1 pt
SHENANDOAH SINGLE-FAMILY
Sold at or above asking
2017
15%
2018
18%
CHANGE
↑ 3 pts
SHENANDOAH SINGLE-FAMILY
Homes listed for sale
2017
167
2018
162
CHANGE
↓ 3%
SHENANDOAH SINGLE-FAMILY
Months of supply (approx.)
2017
7.4
2018
5.7
CHANGE
↓ 1.7
SHENANDOAH SINGLE-FAMILY
Listings that sold (approx.)
2017
65%
2018
63%
CHANGE
↓ 2 pts
SHENANDOAH SINGLE-FAMILY
Median living area
2017
1,705 sq. ft.
2018
1,716 sq. ft.
CHANGE
↑ 1%
SHENANDOAH SINGLE-FAMILY
Median lot size
2017
5,942 sq. ft.
2018
5,900 sq. ft.
CHANGE
↓ 1%
Approximate figures are estimated from listings that expired or were cancelled without selling; homes relisted and sold within a year are counted as sold.
2018 Month by Month
Swipe sideways to see all columns →
MONTH
CLOSED SALES
MEDIAN SOLD PRICE
MEDIAN $ / SQ. FT.
MEDIAN DAYS ON MARKET
SOLD VS. ORIGINAL LIST
MONTH
January
CLOSED SALES
11
MEDIAN SOLD PRICE
$360,000
MEDIAN $ / SQ. FT.
$215
MEDIAN DAYS ON MARKET
105
SOLD VS. ORIGINAL LIST
91.8%
MONTH
February
CLOSED SALES
7
MEDIAN SOLD PRICE
$500,000
MEDIAN $ / SQ. FT.
$220
MEDIAN DAYS ON MARKET
57
SOLD VS. ORIGINAL LIST
97.0%
MONTH
March
CLOSED SALES
14
MEDIAN SOLD PRICE
$457,500
MEDIAN $ / SQ. FT.
$259
MEDIAN DAYS ON MARKET
71
SOLD VS. ORIGINAL LIST
95.1%
MONTH
April
CLOSED SALES
6
MEDIAN SOLD PRICE
$389,025
MEDIAN $ / SQ. FT.
$307
MEDIAN DAYS ON MARKET
145
SOLD VS. ORIGINAL LIST
93.5%
MONTH
May
CLOSED SALES
11
MEDIAN SOLD PRICE
$410,000
MEDIAN $ / SQ. FT.
$235
MEDIAN DAYS ON MARKET
84
SOLD VS. ORIGINAL LIST
93.1%
MONTH
June
CLOSED SALES
11
MEDIAN SOLD PRICE
$465,000
MEDIAN $ / SQ. FT.
$289
MEDIAN DAYS ON MARKET
53
SOLD VS. ORIGINAL LIST
92.9%
MONTH
July
CLOSED SALES
11
MEDIAN SOLD PRICE
$390,000
MEDIAN $ / SQ. FT.
$286
MEDIAN DAYS ON MARKET
105
SOLD VS. ORIGINAL LIST
93.6%
MONTH
August
CLOSED SALES
7
MEDIAN SOLD PRICE
$435,000
MEDIAN $ / SQ. FT.
$302
MEDIAN DAYS ON MARKET
110
SOLD VS. ORIGINAL LIST
89.4%
MONTH
September
CLOSED SALES
9
MEDIAN SOLD PRICE
$430,000
MEDIAN $ / SQ. FT.
$245
MEDIAN DAYS ON MARKET
59
SOLD VS. ORIGINAL LIST
91.1%
MONTH
October
CLOSED SALES
11
MEDIAN SOLD PRICE
$520,000
MEDIAN $ / SQ. FT.
$258
MEDIAN DAYS ON MARKET
14
SOLD VS. ORIGINAL LIST
96.0%
MONTH
November
CLOSED SALES
7
MEDIAN SOLD PRICE
$435,500
MEDIAN $ / SQ. FT.
$277
MEDIAN DAYS ON MARKET
38
SOLD VS. ORIGINAL LIST
96.6%
MONTH
December
CLOSED SALES
4
MEDIAN SOLD PRICE
$357,500
MEDIAN $ / SQ. FT.
$242
MEDIAN DAYS ON MARKET
24
SOLD VS. ORIGINAL LIST
90.8%
Closed Sales by Month
2018 · single-family homes
Where Homes Sold: Price Ranges
Closed single-family sales by price range, 2017 vs. 2018
Existing Homes vs. New Construction
Swipe sideways to see all columns →
HOME TYPE
SALES
MEDIAN PRICE
$ / SQ. FT.
MEDIAN DOM
HOME TYPE
Built before 1960
SALES
100
MEDIAN PRICE
$435,000
$ / SQ. FT.
$264
MEDIAN DOM
66
HOME TYPE
Built 1960–2014
SALES
7
MEDIAN PRICE
$365,000
$ / SQ. FT.
$204
MEDIAN DOM
27
HOME TYPE
New construction (2015–2018)
SALES
2
MEDIAN PRICE
$636,500
$ / SQ. FT.
$354
MEDIAN DOM
38
Shenandoah Closed Sales, 2018
109 single-family sales · highest price first
Swipe sideways to see all columns →
ADDRESS
CLOSED PRICE ▼
$ / LIVING SQ. FT.
BEDS / BATHS
LIVING SQ. FT.
LOT SQ. FT.
DAYS ON MARKET
SOLD VS. ORIGINAL LIST
CLOSING DATE
ADDRESS
2030 SW 12th Ave.
CLOSED PRICE
$830,000
$ / LIVING SQ. FT.
$274
BEDS / BATHS
5 / 4.5
LIVING SQ. FT.
3,032
LOT SQ. FT.
6,534
DAYS ON MARKET
257
SOLD VS. ORIGINAL LIST
92.3%
CLOSING DATE
Jun 11
ADDRESS
1724 SW 22nd Ave.
CLOSED PRICE
$752,000
$ / LIVING SQ. FT.
$247
BEDS / BATHS
4 / 3
LIVING SQ. FT.
3,050
LOT SQ. FT.
10,492
DAYS ON MARKET
399
SOLD VS. ORIGINAL LIST
100.3%
CLOSING DATE
Mar 5
ADDRESS
1823 SW 13th St.
CLOSED PRICE
$749,000
$ / LIVING SQ. FT.
$252
BEDS / BATHS
3 / 2
LIVING SQ. FT.
2,971
LOT SQ. FT.
8,850
DAYS ON MARKET
106
SOLD VS. ORIGINAL LIST
94.9%
CLOSING DATE
Mar 7
ADDRESS
1401 SW 11th Ter.
CLOSED PRICE
$735,000
$ / LIVING SQ. FT.
$354
BEDS / BATHS
4 / 3
LIVING SQ. FT.
2,076
LOT SQ. FT.
5,855
DAYS ON MARKET
18
SOLD VS. ORIGINAL LIST
98.1%
CLOSING DATE
Jun 1
ADDRESS
1440 SW 12th Ave.
CLOSED PRICE
$728,000
$ / LIVING SQ. FT.
$392
BEDS / BATHS
4 / 2
LIVING SQ. FT.
1,855
LOT SQ. FT.
9,842
DAYS ON MARKET
26
SOLD VS. ORIGINAL LIST
91.1%
CLOSING DATE
Sept 21
ADDRESS
1221 SW 17th St.
CLOSED PRICE
$725,000
$ / LIVING SQ. FT.
$318
BEDS / BATHS
4 / 3
LIVING SQ. FT.
2,278
LOT SQ. FT.
8,625
DAYS ON MARKET
91
SOLD VS. ORIGINAL LIST
92.4%
CLOSING DATE
Jun 15
ADDRESS
1200 SW 18th St.
CLOSED PRICE
$720,000
$ / LIVING SQ. FT.
$259
BEDS / BATHS
3 / 2.5
LIVING SQ. FT.
2,778
LOT SQ. FT.
9,559
DAYS ON MARKET
53
SOLD VS. ORIGINAL LIST
92.9%
CLOSING DATE
Jun 8
ADDRESS
1430 SW 12th Ave.
CLOSED PRICE
$720,000
$ / LIVING SQ. FT.
$263
BEDS / BATHS
4 / 3
LIVING SQ. FT.
2,735
LOT SQ. FT.
9,525
DAYS ON MARKET
215
SOLD VS. ORIGINAL LIST
93.6%
CLOSING DATE
Jul 5
ADDRESS
2171 SW 20th St.
CLOSED PRICE
$690,000
$ / LIVING SQ. FT.
$383
BEDS / BATHS
4 / 4
LIVING SQ. FT.
1,800
LOT SQ. FT.
6,060
DAYS ON MARKET
6
SOLD VS. ORIGINAL LIST
100.0%
CLOSING DATE
Nov 21
ADDRESS
1300 SW 16th Ave.
CLOSED PRICE
$675,000
$ / LIVING SQ. FT.
$331
BEDS / BATHS
3 / 2.5
LIVING SQ. FT.
2,038
LOT SQ. FT.
7,321
DAYS ON MARKET
42
SOLD VS. ORIGINAL LIST
96.4%
CLOSING DATE
Mar 1
ADDRESS
1735 SW 11th St.
CLOSED PRICE
$675,000
$ / LIVING SQ. FT.
$291
BEDS / BATHS
4 / 4
LIVING SQ. FT.
2,322
LOT SQ. FT.
5,900
DAYS ON MARKET
45
SOLD VS. ORIGINAL LIST
93.1%
CLOSING DATE
Nov 29
ADDRESS
1320 SW 15th St.
CLOSED PRICE
$670,000
$ / LIVING SQ. FT.
$329
BEDS / BATHS
3 / 2.5
LIVING SQ. FT.
2,037
LOT SQ. FT.
7,250
DAYS ON MARKET
8
SOLD VS. ORIGINAL LIST
99.3%
CLOSING DATE
Oct 22
ADDRESS
1641 SW 16th St.
CLOSED PRICE
$667,000
$ / LIVING SQ. FT.
$285
BEDS / BATHS
4 / 2.5
LIVING SQ. FT.
2,338
LOT SQ. FT.
10,900
DAYS ON MARKET
9
SOLD VS. ORIGINAL LIST
96.7%
CLOSING DATE
Mar 30
ADDRESS
1251 SW 21st Ave.
CLOSED PRICE
$650,000
$ / LIVING SQ. FT.
$280
BEDS / BATHS
4 / 3
LIVING SQ. FT.
2,321
LOT SQ. FT.
8,617
DAYS ON MARKET
10
SOLD VS. ORIGINAL LIST
97.0%
CLOSING DATE
Feb 7
ADDRESS
1800 SW 13th St.
CLOSED PRICE
$649,000
$ / LIVING SQ. FT.
BEDS / BATHS
8 / 5.5
LIVING SQ. FT.
LOT SQ. FT.
12,154
DAYS ON MARKET
13
SOLD VS. ORIGINAL LIST
100.0%
CLOSING DATE
Aug 3
ADDRESS
1275 SW 15th Ter.
CLOSED PRICE
$635,000
$ / LIVING SQ. FT.
$370
BEDS / BATHS
3 / 2
LIVING SQ. FT.
1,715
LOT SQ. FT.
5,750
DAYS ON MARKET
14
SOLD VS. ORIGINAL LIST
100.0%
CLOSING DATE
Oct 5
ADDRESS
2364 SW 11th Ter.
CLOSED PRICE
$580,000
$ / LIVING SQ. FT.
$256
BEDS / BATHS
5 / 3
LIVING SQ. FT.
2,266
LOT SQ. FT.
5,850
DAYS ON MARKET
5
SOLD VS. ORIGINAL LIST
105.6%
CLOSING DATE
Oct 1
ADDRESS
2543 SW 15th St.
CLOSED PRICE
$577,000
$ / LIVING SQ. FT.
$265
BEDS / BATHS
5 / 3
LIVING SQ. FT.
2,179
LOT SQ. FT.
6,900
DAYS ON MARKET
80
SOLD VS. ORIGINAL LIST
88.9%
CLOSING DATE
Jun 15
ADDRESS
1724 SW 16th St.
CLOSED PRICE
$575,000
$ / LIVING SQ. FT.
$220
BEDS / BATHS
4 / 3
LIVING SQ. FT.
2,612
LOT SQ. FT.
10,900
DAYS ON MARKET
20
SOLD VS. ORIGINAL LIST
96.3%
CLOSING DATE
Oct 12
ADDRESS
2055 SW 18th Ave.
CLOSED PRICE
$562,000
$ / LIVING SQ. FT.
$231
BEDS / BATHS
4 / 2
LIVING SQ. FT.
2,431
LOT SQ. FT.
7,141
DAYS ON MARKET
100
SOLD VS. ORIGINAL LIST
99.0%
CLOSING DATE
Feb 8
ADDRESS
1420 SW 11th St.
CLOSED PRICE
$560,000
$ / LIVING SQ. FT.
$222
BEDS / BATHS
5 / 3
LIVING SQ. FT.
2,520
LOT SQ. FT.
5,900
DAYS ON MARKET
429
SOLD VS. ORIGINAL LIST
70.1%
CLOSING DATE
Oct 31
ADDRESS
1328 SW 17th St.
CLOSED PRICE
$550,000
$ / LIVING SQ. FT.
$277
BEDS / BATHS
3 / 3
LIVING SQ. FT.
1,989
LOT SQ. FT.
7,250
DAYS ON MARKET
38
SOLD VS. ORIGINAL LIST
92.4%
CLOSING DATE
Nov 7
ADDRESS
2389 SW 17th Ter.
CLOSED PRICE
$540,000
$ / LIVING SQ. FT.
$339
BEDS / BATHS
3 / 2
LIVING SQ. FT.
1,594
LOT SQ. FT.
7,974
DAYS ON MARKET
360
SOLD VS. ORIGINAL LIST
93.9%
CLOSING DATE
Jul 6
ADDRESS
2023 SW 14th Ter.
CLOSED PRICE
$538,000
$ / LIVING SQ. FT.
BEDS / BATHS
3 / 2
LIVING SQ. FT.
LOT SQ. FT.
7,150
DAYS ON MARKET
57
SOLD VS. ORIGINAL LIST
98.7%
CLOSING DATE
Feb 9
ADDRESS
1860 SW 11th St. FEATURED SOLD BY JORGE
CLOSED PRICE
$530,000
$ / LIVING SQ. FT.
$279
BEDS / BATHS
4 / 2
LIVING SQ. FT.
1,900
LOT SQ. FT.
5,900
DAYS ON MARKET
112
SOLD VS. ORIGINAL LIST
96.5%
CLOSING DATE
Dec 27
ADDRESS
All 109 sales · median
CLOSED PRICE
$435,000
$ / LIVING SQ. FT.
$263
BEDS / BATHS
LIVING SQ. FT.
1,716
LOT SQ. FT.
5,900
DAYS ON MARKET
64
SOLD VS. ORIGINAL LIST
93.1%
CLOSING DATE
Source: Southeast Florida MLS.
How the Month Compared
SHENANDOAH
PRIOR
MONTH
CHANGE
SHENANDOAH
–
PRIOR
–
MONTH
–
CHANGE
–
THE LAST 12 MONTHS
The Last 12 Months in Shenandoah
Chart
Chart
ALL SALES, ROLLING 12 MONTHS
Rolling 12-month figures are calculated from closed MLS sales.
The charts illustrate monthly price fluctuations, while the rolling 12-month figures reflect all qualifying closed sales during the period, providing a broader perspective on Shenandoah’s market.
What 2018 Means for Buyers and Sellers in Shenandoah
SELLERS
For sellers, rising prices per square foot were encouraging, but buyers still negotiated. Pricing in line with recent comparable sales remained the key to selling in a reasonable time.
BUYERS
For buyers, rising mortgage rates added to monthly costs, but there was still room to negotiate. Homes that had been on the market for a while often offered the best opportunities.
Text
YOUR SHENANDOAH HOME VALUE
Considering Selling a Home in Shenandoah?
Get a personalized valuation informed by current neighborhood sales and firsthand local experience.
Jorge Fernandez | The Shenandoah Guys | SERHANT.
About This Year in Review
This report analyzes single-family home sales and market activity in Shenandoah, Miami, for calendar year 2018, using Southeast Florida MLS data. Jorge Fernandez provides firsthand market analysis and local context to explain the why behind the data and what it means for Shenandoah homeowners, sellers and buyers.
REPORTING PERIOD
January 1 – December 31, 2018
MLS DATA CURRENT AS OF
—
PUBLISHED
—
DATA SOURCE
Southeast Florida MLS
Condominium and townhome sales are not included. Sales referenced may include properties in which Jorge Fernandez/The Shenandoah Guys at SERHANT. Florida LLC did not represent the buyer or seller. Information is provided for market analysis purposes.

REPORT PREPARED BY
Jorge Fernandez, REALTOR®
The Shenandoah Guys | SERHANT. Florida
Professional Recognition & Designations
2026 RealTrends Verified | Top 1.5% Nationwide
Certified Luxury Home Marketing Specialist (CLHMS™) | Million Dollar GUILD™
Master Brokers Forum | Advisory Board
Local Expertise
Miami Native | 21+ Years of Real Estate Experience | 10-Year Shenandoah Resident
Florida Real Estate License #SL3158278
Florida Real Estate License #SL3158278
The Shenandoah Guys | SERHANT. Florida
Miami Native | 21+ Years of Real Estate Experience | 10-Year Shenandoah Resident
← PREVIOUS REPORT
NEXT REPORT →